A Quick Solution to an Ugly Reverse Engineering Problem

Reverse engineering tools tend to be developed against fundamental assumptions, for example, that binaries will more or less conform to the standard patterns generated by compilers; that instructions will not jump into other instructions; perhaps that symbols are available, etc. As any reverse engineer knows, your day can get worse if the assumptions are violated. Your tools may work worse than usual, or even stop working entirely. This blog post is about one such minor irritation, and the cheap workaround that I used to fix it.

In particular, the binary I was analyzing -- one function in particular -- made an uncommon use of an ordinary malware subterfuge technique, which wound up violating ordinary assumptions about the sizes of functions. In particular, malware authors quite often build data that they need -- strings, most commonly -- in a dynamic fashion, so as to obscure the data from analysts using tools such as "strings" or a hex editor. (Malware also commonly enciphers its strings somehow, though that is not the feature that I'll focus on in this entry.) As such, we see a lot of the following in the function in question.

ManyStackWrites.png

What made this binary's use of the technique unusual was the scale at which it was applied. Typically the technique is used to obscure strings, usually no more than a few tens of bytes apiece. This binary, on the other hand, used the technique to build two embedded executables, totaling about 16kb in data -- hence, there are about 16,000 writes like the one in the previous figure, each implemented by a 7-byte instruction. The function pictured above comprises about 118KB of code -- over 25% of the total size of the binary. The function would have been large even without this extra subterfuge, as it has about 7kb of compiled code apart from the instructions above.

The Hex-Rays decompilation for this function is about 32,500 lines. The bulk of this comes from two sources: first, the declaration of one stack local variable per written stack byte:

HR-ManyStackVariables.png

Second, one assignment statement per write to a stack variable:

HR-ManyStackWrites.png

To IDA's credit, it handles this function just fine; there is no noticeable slowdown in using IDA to analyze this function. Hex-Rays, however, has a harder time with it. (I don't necessarily blame Hex-Rays for this; the function is 118KB, after all, and Hex-Rays has much more work to do than IDA does in dealing with it.) First, I had to alter the Hex-Rays decompiler options in order to even decompile the function at all:

HR-DecompilerOptions.png

After making this change, Hex-Rays was very slow in processing the function, maxing out one of my CPU cores for about five minutes every time I wound up decompiling it. This is suboptimal for several reasons:

  • I often use the File->Produce file->Create .c file... menu command more than once while reverse engineering a particular binary. This function turns every such command into a cigarette break.

  • Some plugins, such as Referee, are best used in conjunction with the command just mentioned.

  • When using the decompiler on this function in an interactive fashion (such as by renaming variables or adding comments), the UI becomes slow and unresponsive.

  • Randomly looking at the cross-references to or from a given function becomes a game of Russian Roulette instead of a normally snappy and breezy part of my reverse engineering processes. Decompile the wrong function and you end up having to wait for the decompiler to finish.

Thus, it was clear that it was worth 15 minutes of my time to solve this problem. Clearly, the slowdowns all resulted from the presence of these 16,000 write instructions. I decided to simply get rid of them, with the following high-level plan:

  • Extract the two .bin files written onto the stack by the corresponding 112KB of compiled code

  • Patch those .bin files into the database

  • Replace the 112KB worth of instructions with one patched call to memcpy()

  • Patch the function's code to branch over the 112KB worth of stack writes

The first thing I did was copy and paste the Hex-Rays decompilation of the stack writes into its own text file. After a few quick sanity checks to make sure all the writes took place in order, I used a few regular expression search-and-replace operations and a tiny bit of manual editing to clean the data up into a format that I could use in Python.

PythonCleanedUp.png

Next, a few more lines of Python to save the data as a binary file:

PythonSaveBinary.png

From there, I used IDA's Edit->Patch program->Assemble... command to write a small patch into the corresponding function:

IDA-AssembleCommand.png

After a bit of fiddling and manual hex-editing the results, my patch was installed:

Patched.png

And then I used a two-line IDC script to load the binary files as data in the proper location:

IDC.png

Afterwards, the navigation bar showed that about 31% of the text section had been converted into data:

IDA-NavBarAfter.png

And now the problem is fixed. The function takes approximately two seconds to decompile, more in line with what we'd expect for a 7kb function. Hooray; no more endless waiting, all for the time cost of about three accidental decompilations of this function.

This example shows that, if you know your tools well enough to know what causes them problems, that sometimes you can work your way around them. Always stay curious, experiment, and don't simply settle for a suboptimal reverse engineering experience without exploring whether there might be an easier solution.

Hex-Rays CTREE API Scripting: Automated Contextual Function Renaming

One thing I teach my students in my static reverse engineering training classes is to exploit information that programmers have left in the binaries for debugging purposes. The most obvious example of this is when the program contains a debug logging function, where one of the parameters is the function's name. In this case, the reverse engineer can write a script to extract the function names and automatically rename the calling function, thus saving valuable time and making their lives easier. (I teach several other example scenarios.)

Inspired by my recent forays into the Hex-Rays API, today I found a new method for exploiting such ad hoc debug-type information. This entry will demonstrate how to use the Hex-Rays CTREE API to extract information and automatically rename functions as a result, which would otherwise be more cumbersome and error-prone to do with the ordinary IDA SDK. The code is available here.

In particular, today I was reverse engineering the Hex-Rays decompiler itself. The Hex-Rays API is unusual in that the user-accessible API functions are not defined as exports from hexrays.dll. (In fact, hexrays.dll exports only the standard DLL entrypoint, as well as the standard plugin_t structure required of all IDA plugins.) Instead, the "exported" API methods are all declared as small inline functions that each invoke the same function, namely "hexdsp", which serves as a central dispatcher to the public Hex-Rays API functions. The first parameter to hexdsp is an enumeration element of type "hexcall_t", which tells the Hex-Rays kernel which API is being called, and the subsequent parameters (of which there are a variable number) are specific to the called API. (Internally to hexrays.dll, the hexdsp function performs a switch over the hexcall_t parameter, and then invokes the specified function.)

To be concrete about it, the last 3500 lines of hexrays.hpp all look roughly like this:

HexDsp.png

If the API functions had been exported from the DLL, IDA would have automatically renamed them for us, which would have made trivial the task of finding the APIs that we wanted to reverse engineer. Instead, nearly none of the functions in the the database have meaningful names.

The lack of meaningful function names does not prove to be a huge impediment to reverse engineering Hex-Rays API functions. We simply need to locate the hexdsp function in hexrays.dll, and locate the switch case that corresponds to the hexcall_t enumeration element that interests us. Most of these switch cases are one-liners that immediately invoke the relevant API function.

To find hexdsp, we can textually search the disassembly listing for the word "switch", which IDA inserts automatically as a comment upon encountering a compiled switch construct.

TextSearch.png

Next, we can filter the search by the word "cases" to obtain the beginning of each switch construct, as well as the number of cases that the switch contains.

FilteredSearch.png

Finally, we can count the number of enumeration elements in hexcall_t, and look for a switch with roughly that many cases. (For this, I simply selected the contents of the hexcall_t enumeration in my text editor, and looked at the "lines selected" display at the bottom.) hexcall_t contains 532 enumeration elements, and one of the switches has exactly 532 cases. That must be hexdsp.

Now, to reverse engineer any particular API function, we just need to find the value of the associated constant in the hexcall_t enumeration, and examine that particular switch case. IDA can offer us some more assistance here, also. I begin by copying and pasting the hexcall_t enumeration into its own text file and saving it:

hexcall_t_C.png

Next, I use IDA's C header parsing functionality to automatically create an enumeration that I can use inside of IDA. If successful, we get a message box telling us so.

ParseCHeaderFile.png

In IDA's Enumerations window, now we need to add the enumeration we just imported. Press insert to bring up the "Add enum type" window, and then use the "Add standard enum by enum name" option near the bottom. It will bring up a list of all currently-known enumerations; the one we just imported will be at the bottom.

LoadEnum.png

We can use this enumeration to make the decompilation listing prettier. The decompiled switch statement currently shows the hexcall_t enumeration elements as integers. We can ask Hex-Rays to display them as enumeration element names instead, by placing our cursor on one of the integers and pressing 'M'.

HRApplyEnum.png

Select the hexcall_t entry from the dialog that pops up and press enter. Voila, now we see the enumerated names in the decompilation listing:

HREnumApplied.png

At this point, locating particular Hex-Rays API functions is pretty easy. The switch now uses human-readable names for the enumeration elements; we just find the one we're interested in, and look at the function called in that switch case. To wit, here's gen_microcode(), the one I had been after in the first place:

SwitchPrettyNames.png

Of course, finding the correct switch case is still tedious, given that there are 532 of them. I thought that the nicest solution would be to rename the functions after the name of the hexcall_t enumeration element in the corresponding switch case. Of course, doing this by hand for all 532 hexcall_t enumeration elements would be a waste of time, and we should automate it instead.

For this task, I decided to use the Hex-Rays CTREE API via IDAPython, which I discussed somewhat in my recent blog entry about the Hex-Rays Microcode API. My observation was that we could extract the case number from the case statements, get the name of the pertinent enumeration element, extract the address of the called function from the first line of code in the case body (if the first line does call a function), and then rename the called address after the enumeration element. Using the Hex-Rays API saves us from having to write nasty, brittle code to search the disassembly listing instruction-by-instruction, and also makes it convenient for us to access the switch case numbers and their associated case statement bodies.

Our script will make use of so-called "CTREE visitor" objects. Our CTREE visitor classes contain methods such as "visit_insn" and "visit_expr", which Hex-Rays will invoke for every element in the CTREE listing.

The first visitor, which I called SwitchExaminer, exists merely to locate the switch statement within hexdsp's decompilation listing. Once found, it iterates over each switch case. For each case, it first extracts the case number. Next, it then extracts the first line of code in the body of the case statement, and passes it to another visitor. The second visitor, called a CallExtractor, extracts the addresses of all called functions (if any).

Finally, some glue code at the bottom of the script applies the visitors to the decompilation of hexdsp, and then renames the called functions after the hexcall_t enumerated element numbers that were collected from the switch statement.

That's all; after about 100 lines of heavily-commented IDAPython code, the script renames 436 functions for us automatically, nearly 10% of the non-library, non-thunk functions in the binary.

DecompRenamed.png

You can find the code here. A small note is that the code takes advantage of an IDAPython wrapper function regarding switch case values, which exists in IDA 7.2 beta, but does not exist in IDA 7.1 or below. In particular, you will not be able to run the script as-is until IDA 7.2 is released. If you would like to do something similar with a different use case that does not require you to extract switch case label values, you might be able to adapt the existing code for that purpose in the meantime.

Weekend Project: A Custom IDA Loader Module for the Hidden Bee Malware Family

Here's a half-day project that I did this weekend for my own edification. Perhaps someone will benefit from the source code in the future.

While reading hasherezade's research on the Hidden Bee malware family's custom file format (samples here), I was struck with the thought that this use-case seemed particularly well-suited for an IDA custom loader module. The IDA loader module approach has a few advantages over the previous approach: it's fully automated, requiring no additional programs, plugins, or scripts; the imports have proper names and type information, allowing IDA's ordinary P.I.T. algorithms to propagate the information; and the user can relocate the database to an arbitrary base address.

LoaderScreen.png

Given that custom loaders are the only variety of IDA plugin that I haven't yet written, this seemed like a nice small-scope project for the weekend to round out my knowledge. My very minor contribution with this entry is the IDA custom loader for the Hidden Bee format, which can be found on my GitHub. The IDAPython code requires that Ero Carrera's pefile module be installed, say via pip. 

Hidden Bee

In brief, the Hidden Bee malware family distributes payloads in a customized file format, which is a majorly stripped-down version of the PE file format. You can see all of the details in hasherezade's write-up. I did no original malware analysis for this project; I merely read her blog entry, figured out how to convert the details into a loader plugin, and then debugged it against the sample links she gave. As usual, Chris Eagle's The IDA Pro Book, 2nd Edition was useful. Some details about the loader API have changed with the IDA 7.x API port, but Hex-Rays' porting guide was informative, and the loader examples in the IDA 7.1 SDK have also been ported to the newest API.

IDA Loader Modules in Brief

An IDA loader module is simply an IDA plugin with a well-defined interface. IDA loader modules will be called when loading any file into IDA. They have two primary responsibilities: 

  1. Given access to the bytes of a file, determine whether the file is of a format that the loader module can handle. Every IDA loader module must export a function named accept_file for this purpose. This function returns 0 if it can't recognize the file format, or a non-zero value if it can.
  2. If the file type can be loaded by the module, and the user chooses to use this module to load the file, perform the actual loading process e.g. creating segments within the IDB, copying bytes out of the file into the segments, processing relocations, parsing imports, adding entrypoints, and so on. Every IDA loader module must export a function named load_file for this purpose.

Both of these functions take as input an "linput_t *" object that behaves like a C FILE * object, which supports seeking to specified positions, reading byte arrays out of the file, and so on. Since Hidden Bee's format includes relocations, I chose to implement a third, optional IDA loader module function: move_segm. This function will be called by the IDA kernel when the user requests that the database be relocated to another address.

Writing a Loader Module for Hidden Bee

After reading the aforementioned write-up, I figured that the only difficulties in loading Hidden Bee images in IDA would be A) that the Hidden Bee customized header specifies API imports via hash rather than by name, and B) that it includes relocation information. Relocations and import lookup via hash are simple enough conceptually, but the precise details about how best to integrate them with IDA are not obvious. Sadly, I did not feel confident in these tasks even after reading the loader module examples in the SDK. Four out of the five hours I spent on this project were reverse engineering %IDADIR%\loaders\pe.dll -- the loader module for the PE file format -- focusing in particular on its handling of relocations and imports. As expected, the results are idiosyncratic and I don't expect them to generalize well. 

Imports

For dealing with the imports by hash, hasherezade's toolchain ultimately generates a textual file with the addresses of the import hash names and their corresponding plaintext API string. Then, she uses one of her other plugins to create repeating comments at the addresses of the import hash DWORDs. Instead, I wanted IDA to show me the import information the same way it would in a normal binary -- i.e., I wanted IDA to set the proper type signature on each import. I figured this might be difficult, but after a few hours reverse engineering the virtual functions for the pe_import_visitor_t class (partially documented in %IDASDK%\ldr\pe\common.hpp), it turns out that all you have to do to trigger this functionality is simply to set the name of the DWORD to something from a loaded type library.

Here's a screenshot showing IDA successfully applying the type information to the APIs:

ImportNames.png

Relocations

For the IMAGE_REL_BASED_HIGHLOW relocations common in PE files, each can ultimately be processed via straightforward translation of the relocation information into IDA's fixup_data_t data structures, and then passing them to the set_fixup API. The SDK examples did not give a straightforward idea of what I needed to do to handle PE IMAGE_REL_BASED_HIGHLOW relocations properly, so I reverse engineered pe.dll to figure out exactly what needed to happen with the relocations. (Fortunately, reverse engineering IDA is trivial due to the availability of its SDK.) If you wish, you can see the results in the do_reloc function. Don't ask me to explain why it works; however, it does work.

Here's a before and after comparison of rebasing the database from base address 0x0 to base address 0x12340000. Note particularly that the red underlined bytes change. Before:

RebaseBefore.png

After:

RebaseAfter.png

The Atredis BlackHat 2018 CTF Challenge

This post covers my solution to the Atredis BlackHat 2018 challenge, for which I won second place and a ticket to BlackHat. I'd like to express my gratitude to the author, the increasingly-reclusive Dionysus Blazakis, as well as Atredis for running the contest.

Initial Recon

As you can see from the screenshot in the tweet linked above, and reproduced below, once you connect to the network service on arkos.atredis.com:4444, the system prints information about the firmware and hardware version, as well as the memory map. Following that is the message-of-the-day, which contains a reference to 8-bit computing. 

AtredisChall.jpg

It also prints the contents of an email, which makes reference to an attachment having been written to disk. It seems like the immediate goal of the challenge is clear: retrieve the attachment from disk.

AtredisMail.png

At about 8:30PM, I logged into the system for the first time. The challenge had been released at 2PM and I figured many people would have already solved it. Not knowing what to do at the prompt, I typed "help". The system replied by printing information about two commands: "help" and "read", with an example of how to use "read":

'read F400' reads the byte at $F400

I ran that command and it came back with the value 31, or '1' in ASCII. I ran the command for a few adjacent addresses and this location seemed to contain the hardware version string "1.0.3 rev A", part of what was printed initially in the first messages upon connecting to the service.

Dumping the Firmware

At first blush, there wasn't much more to do than read bytes off of the system at specified addresses. However, this challenge was not my first rodeo in the embedded reverse engineering space. I was immediately reminded of an exploit I once wrote for a SOHO router, where, once I obtained its memory map, I used an arbitrary read vulnerability to dump its memory contents so I could further analyze the software in IDA. I decided to do something very similar here, minus the need for an arbitrary read vulnerability.

Although I don't like Python much as a programming language, I do have to credit it for having an absurdly large standard library. In particular, while previously writing the aforementioned exploit, I made use of Python's Telnetlib module to automate interaction with the router. Nothing seemed to be stopping me from doing the same thing in this situation, so I spent about 10 minutes writing a 30-or so line Python script to log into the device, repeatedly send "read" commands, parse the resulting output, and save the results to a binary file. That functionality combined with the memory map printed by the device upon connection was all that was needed. You can find the dumped memory as .bin files here.

My script took nearly four hours to dump the memory. I don't know how much of that was related to the crappy Wi-Fi at my hotel, and how much had to do with other contestants hammering the server. Nevertheless, by the time I had the memory dump, it was 12:15AM and I had a business engagement in the morning. I needed to finish quickly so I could sleep.

Inspecting the Firmware

I began by briefly inspecting the dumped memory contents in a hex editor. The three regions which, in total, encompassed the range 0x0000-0x1FFF, were entirely zero. Only a few bytes within 0xF000-0xFEFF were non-zero. In the range 0xFF00-0xFFFF, only the final three words were non-zero.

The most interesting dumped memory range was 0x4000-0xEFFF. It began with the strings that the server printed upon connection, as well as others that had not been printed. The most interesting strings were "write" and "call", which seem like they might have been commands that the user could execute on the system. After these strings, the memory dump had zeroes until address 0x8000.

Strings.png

At address 0x8000, there were 0x542 bytes of unknown binary data, with the remainder of the region being zeroes. Now that I've inspected the entire memory space, if this thing has any code in it at all, it must be the bytes at 0x8000-0x8542. The only other non-zero, unknown data is the few sporadic, isolated bytes previously mentioned in the range of 0xF000-0xFFF.

I connected to the system again and tried executing the "call" command I had discovered in the strings. I provided it the address 8000, which seemed to be the beginning of the code in the memory image. The thing printed:

JSR $8000

Apart from that, nothing happened. Next, I executed "call 7FFF" and the system reset. I took that as a positive sign.

Determining the Architecture

At this point, I did not know what architecture I was dealing with. I had two hints. First, the message-of-the-day string made reference to 8-bit computing. Second, the "call" command had printed the string "JSR", which on some architectures is a mnemonic for "jump to subroutine" (i.e., the same functionality known as "call" on x86). The best logical guess right now is that we are dealing with an 8-bit architecture where the mnemonic for the call instruction is "JSR".

I wish I could tell you I used a systematic procedure in searching for such an architecture, but I would be lying. In retrospect, I could have loaded %IDASDK%\include\allins.hpp and searched for "jsr". The string occurs 32 times in that file, which would have given me a pile of possibilities:

  • Angstrem KR1878
  • DEC ALPHA
  • DEC PDP-11
  • Freescale M68HC12 or M68HC16 or HCS12 
  • Java bytecode
  • Mitsubishi 740 or 7700 or 7900
  • MOS M65 [e.g. 6502] or M65816
  • Motorola 6809 or 68000
  • Motorola DSP56000
  • Panasonic MN102
  • Renesas H8, H8500, SuperH, or M16C
  • Rockwell C39

Instead what I ended up doing was searching Google for things like "assembly jsr". For any architecture suggested by one of my search results, I loaded the .bin file for the memory at 0x4000, changed the processor type to the one I was testing, and tried to disassemble the file using the relevant processor module. I ran through a few theories, among them System/360 and 68K. For each of my theories, IDA either refused to disassemble most of the code, or the resulting disassembly was gibberish. For example, when loaded as 68000, IDA refused to disassemble much of the code:

68000-gibberish-disasm.png

I almost gave up after about 15 minutes, since I had to be somewhere in the morning. But, a final Google search for "8-bit assembly jsr" brought me to a Wikibooks page on 6502 assembly language, which also has a "jsr" instruction. I loaded the binary as 6502, and lo and behold, the resulting disassembly listing looked legitimate. There were, for example, several loads followed by compares, followed by relatively-encoded short jumps to the same nearby location; loads of 0 or 1 immediately before a RTS (return) instruction, and so on.

M6502-legit-looking-disasm.png

It looked like I had found my winner.

Loading the Binary Properly

Now that I seemed to know the architecture, I needed to load all of the memory dumps into a single IDA database for analysis. This is easy if you know what you're doing. If you do, you may as well skip this section. If you don't know how to do this, read on.

First, I loaded the file for memory range 0x4000-0xEFFF into IDA and changed the processor type to M6502.

LoadAsM6502.png

Next I had to change the loading offset and the region that IDA considered as containing the ROM.

LoadConfig.png

From there, I loaded each of the remaining memory dumps as additional binary files.

LoadBinaryFile.png

For each of those, I had to change their loading offset so they'd be represented at the proper location within the database.

LoadBinaryFileConfig.png

That's all; now the IDB has all of the memory ranges properly loaded. The clean IDB can be found here.

Reverse Engineering the Binary

I only have a few notes on the process of statically reverse engineering this particular binary. That's because, for the most part, I used the same process as I would while statically reverse engineering any binary on any architecture. In particular, I followed the same procedure that I teach in my static reverse engineering training classes. The whole process took 30-40 minutes. You can find the final IDB here.

Reset Vector

It's often useful to know where execution begins when a system or program executes. For embedded devices, the "system entrypoint" is often held as a pointer in the system's reset vector. For example, on 16-bit x86, the memory location F000:FFF0 contains the address to which the processor should branch upon reset.

For this binary, I noticed that the final three words in the memory dump -- at addresses 0xFFFA, 0xFFFC, and 0xFFFE -- all contained the value 0x8530, which happens to be near the end of the region with the code in it. It seems likely that this is our entrypoint. I renamed this location BOOTLOC and began reading.

Bootloc.png

6502 Documentation and Auto Comments

Now my job is to analyze and document 1300 bytes of 6502 code. A slight problem is that I don't know anything in particular about 6502 beyond some tutorials I read years ago. Nevertheless, this was not a major impediment to reverse engineering this binary. Two things helped. First, the Wikibooks web page I had found previously (which had tipped me off that the binary might be 6502) was a reasonably good layman's guide to the instruction set. Whenever I wanted to know more about a particular mnemonic, I searched for it on that page. Most of my questions were answered immediately; a few required me to correlate information from a few different parts within the document. It was good enough that I didn't have to consult any outside sources.

The second feature that helped me was IDA's "auto comments" feature, under Options->General->Auto Comments.

AutoComments.png

Once enabled, IDA leaves brief one-line descriptions of the mnemonics in the same color that it uses for repeating comments. You can see an example in the screenshot below. Although the comments may confuse you if you don't know 6502, the Wikibooks link above was enough to fill in the missing details, at which point the auto comments assisted in rapidly disassembling the binary.

AutoCommentsDisasm.png

Disjointed References

One slightly abnormal feature of this binary -- probably 6502 binaries in general -- is the fact that the instructions usually operate on 8-bit values, but the memory addresses are 16-bits. Thus, when the code needs to write a value into memory that is more than 8 bits, it does so one byte at a time. The following screenshot illustrates:

StringRefsDisasmCode.png

Lines 0x817D-0x8183 write the constant 0x405F into memory (at location 0x80) as a little-endian word. Lines 0x8188-0x818E writes the constant 0x406C to the same location. Lines 0x8193-0x8199 write the constant 0x4081 to the same location.

Those constants stuck out to me as being in the area where the strings are located. Indeed, here's the view of that location:

DisasmStrings.png

Thus, the addresses written by the code previously are those of the first three strings making up the textual description of the memory map that is printed when connecting to the system. (The string references also tip us off that the called function likely prints strings.)

Although splitting larger constants into smaller ones is not unique to M6502 -- for example, compiled binaries for most processors with fixed-width instructions do this -- nevertheless, as far as I know, IDA's support for recognizing and recombining these constructs into macroinstructions must be implemented per processor (as part of the processor module). Evidently, the 6502 processor module does not support fusing writes into pseudo-operations. Therefore, we have to resolve these references manually while reverse engineering. Nevertheless, this is not difficult (and we only have about 1300 bytes of code to analyze). Simply use the "G" keyboard shortcut to jump to the referenced locations when you see them. For strings, just copy and paste the string at the referencing location.

Memory-Mapped I/O

When the system prints its memory map upon startup, the region from 0xF000-0xFF00 is labeled "MMIO", which presumably is short for memory-mapped I/O. Memory-mapped I/O addresses are effectively global variables stored in memory. When you write to a memory-mapped I/O location, the data is accessible to other components such as peripherals (i.e., a screen controller or a disk controller). Similarly, peripherals can also share data with the 6502 component via memory-mapped I/O, such as keyboard input or the results of disk I/O.

Reverse engineering the variables in this range is effectively the same as reverse engineering accesses to any global variable, although you must keep in mind that MMIO output locations might never be read, and MMIO input locations might never be written.

System Description

Once familiar with the basics of 6502, and the particular points described above, I statically reverse engineered the binary's scant 25 functions.

  • Upon boot, the system prints the diagnostic messages we see in the screenshot at the top of this post. 
  • Next, it loads the message-of-the-day off of the file system (from the file /etc/motd) and prints it. 
  • Next, it checks mail (under the file /var/mail/spool/atredis) and prints it. 
  • Finally, it enters into an infinite loop processing user input and dispatching commands.

Reading the code for the final step -- command dispatch -- we can see indeed that "write" and "call" are valid, undocumented commands. The "write" command is ultimately very straightforward: it converts the address and value arguments into hexadecimal, and then write the value to the address. The "call" command is also straightforward, but I found it neat. It creates 6502 code at runtime for a JSR and RTS instruction, which it then invokes. My daily work does not usually involve examining JIT code generation on archaic platforms.

CallImpl.png

File I/O

It's been a while since we mentioned it, but recall from the introduction that when we connected to the system, it printed the most recent mail, and dropped a hint about the attachment having been written to disk. Our ultimate goal in reverse engineering this binary is to find and exfiltrate this mystery file from the disk. The message did not actually give us a filename, or anything of that sort. Let's take a closer look at how the system loads and prints files off of the disk, such as the message-of-the-day and the most recent email.

The full details can be found in the IDB, but the process generally works like this:

  • PrintMOTD() writes a pointer to "/etc/motd" into a global variable X, then calls Load()
  • Load() reads, in a loop, each of the 0x40 disk sectors into a global array Y and compares the first bytes of Y against X
  • Once found, Load() returns 1. The contents of the disk sector are still in Y.
  • If Load() succeeded, PrintMOTD() calls PrintDiskSectors().
  • At this point, the global buffer Y contains not only the name of the file, but also two words; let's call them Z and W. Z indicates the number of the first disk sector which contains the file's contents, and W is the number of sectors that the file occupies.
  • PrintDiskSectors() then consults Z and W from within the global array. Beginning at sector Z, it prints the raw contents of the file onto the screen, and repeats for W sectors.

(My analysis at the time was slightly sloppier than the above. I did not fully understand the role of the values I've called Z and W.)

Enumerating the Disk Contents, Finishing the Challenge

I now had a rough understanding of the mechanism of how files were read from disk and printed to the screen. My understanding also indicated that I could dump the underlying sectors of the disk without needing to know the names of the files comprising those sectors.

In particular: PrintDiskSectors(), at address 0x822C, reads its two arguments from global memory. Those arguments are: 1) Z, i.e., which sector to begin dumping data from, and 2) W, i.e., how many sectors to dump.

And so it was immediately obvious that I could use the undocumented "write" and "call" commands to write whatever I wanted into Z and W and then invoke PrintDiskSectors(). I tried it out in netcat and it worked on the first try -- I was able to dump sector #0.

Thus, I incorporated this functionality into my scripts based on Python's Telnetlib that I had previously used to dump the memory. Since my understanding at the time was a bit off, I ended up with a loop that executed 0x40 times (the number of sectors), which wrote 0x0000 in for Z (i.e., start reading at sector 0), and each iteration of the loop wrote an increasing value into W, starting with 1 and ending with 0x3F. The script would dump the returned data as a binary file, as well as printing it onto the screen. You can find the script here, and its output here.

I let my script run and once it got to the final iteration of the loop, there was a message congratulating me and telling me where to send an email, as well at what the contents should be. I immediately sent an email at 1:35AM, about 80 minutes after I'd first dumped the memory off of the device. Shortly thereafter, I received a personalized email congratulating me on my second-place finish.

Concrete and Abstract Interpretation, Explained through Chess

I've decided to release my presentation (two slide decks) on the theoretical foundations of abstract interpretation, illustrated through the game of chess. It has been collecting dust on my hard drive for five years, so I figured I may as well give it a proper burial.

This was the first thing I wrote as part of what eventually became my SMT-Based Program Analysis training, back when I planned for that course to cover abstract interpretation as well as logical analysis. The idea to use chess as a medium came to me in a nightmare. I spent about six weeks working on it, polishing it, and extending my original ideas to cover broader areas of abstract interpretation than what my nightmare originally entailed. Writing it was a useful exercise; it forced me to muddle through all of the formalism you see in the preliminaries section of an abstract interpretation paper, and digest them well enough that I thought I could present them to other people. And I personally liked what I wrote, especially the detailed figures.

Next, I sent it off to proofreaders. Two of them -- people with graduate degrees in program analysis and mathematics -- also liked it. The other 18 or so of them -- bright people, mostly professional security researchers -- seemed to utterly despise it. I think they were angry at me for sending it to them with a straight face and expecting a response. You know who you are, and I'm sorry for putting you through that. There were some more changes I wanted to make, but the response made me finally realize that you need at least an undergraduate education in mathematics to understand abstract interpretation, no matter how hard I might try to make it friendly. The experience ultimately convinced me that my time was better spent in teaching people about SMT solvers.

Now it's my turn to preemptively offer my apologies, and best wishes for luck, to anybody else who would like to read this. Chances are very good that you are not going to like it, either. The second deck could use some more polishing, but that's the least of your worries. The bigger problem is that the audience for this document is virtually non-existent.

After that compelling interlude, I present:

P.S. if you find any corrections, don't bother sending them since I have no intention of working on this anymore.

Bonus picture, a preview of what awaits you.

ai-lobster.png

FinSpy VM Unpacking Tutorial Part 3: Devirtualization. Phase #4: Second Attempt at Devirtualization

[Note: if you've been linked here without context, the introduction to Part #3 describing its four phases can be found here.]

1. Introduction

In Part #3, Phase #1, we deobfuscated the FinSpy VM bytecode program by removing the Group #2 instructions. In Part #3, Phase #2, we made a first attempt to devirtualize the FinSpy VM bytecode program back into x86 code. This was mostly successful, except for a few issues pertaining to functions and function calls, which we examined in Part #3, Phase #3.

Now we are ready to take a second stab at devirtualizing our FinSpy VM sample. We need to incorporate the information from Part #3, Phase #3 into our devirtualization of X86CALLOUT instructions. After having done so, we will take a second look at the devirtualized program to see whether any issues remain. After addressing one more major observation and a small one, our devirtualization will be complete.

2. Devirtualization, Take Two

We are finally ready to choose an address in the original FinSpy sample at which to insert the devirtualized code, devirtualize the FinSpy VM program, and copy the devirtualized machine code into the original binary. I chose the address 0x500000, for no particular reason other than that it was after any of the existing sections in the binary.

If everything we've done so far has worked correctly, now we have all of the information we need to generate proper functions in our devirtualized program. We have a set containing the non-virtualized functions called by the FinSpy VM program. For virtualized function targets, we have a list containing tuples of the function addresses, the VM instruction key corresponding to the first virtualized instruction in the function, and a list of prologue bytes to prepend before the devirtualization of the first virtualized instruction. 

We derive two dictionaries from the virtualized function information. 

  1. The dictionary named X86_VMENTRY_TO_KEY_DICT maps an X86CALLOUT target to the VM instruction key corresponding to the beginning of the virtualized function body. 
  2. The dictionary named KEY_TO_PROLOGUE_BYTES_DICT maps the VM instruction key to the copied x86 prologue machine code bytes for the function beginning at the VM instruction with that key.

Now we make two changes to our instruction-by-instruction devirtualization process:

  • In the loop that iterates over all VM bytecode instructions and produces the devirtualized output, consult KEY_TO_PROLOGUE_BYTES_DICT to see if the instruction corresponds to the beginning of a virtualized function. If so, insert the prologue bytes before devirtualizing the instruction.
  • When devirtualizing X86CALLOUT instructions, look up the address of the target in the NOT_VIRTUALIZED set. 
    • If the target is in the set, then nothing special needs to be done to devirtualize the X86CALLOUT instruction; emit an x86 CALL instruction with a dummy displacement DWORD of 0x0, and a fixup to later replace the 0x0 value with the proper distance from the source to the target (similarly to how we devirtualized VM jump instructions).
    • If the target is not in the set, then we need to generate an x86 CALL instruction to the devirtualized address of the target's VM instruction key. Emit a dummy x86 CALL instruction as before. Also generate a fixup specifying the offset of the dummy 0x0 displacement DWORD in the x86 CALL instruction, and the target of the X86CALLOUT instruction.

After the instruction-by-instruction devirtualization process, we need to process the fixups generated for the two varieties of X86CALLOUT instructions mentioned above (i.e., based on whether the destination is virtualized or not).

Here is partial code from the second approach at devirtualization.

# This is the same devirtualization function from before, but
# modified to devirtualize X86CALLOUT instructions and insert
# function prologues where applicable.
# It has a new argument: "newImageBase", the location in the
# FinSpy-virtualized binary at which we emit our devirtualized
# code.
def RebuildX86(insns, newImageBase):

    # These are the same as before:
    mcArr  = [] # Machine code array into which we generate code
    locsDict = dict() # VM location -> x86 position dictionary
    keysDict = dict() # VM key -> x86 position dictionary
    locFixups = []    # List of fixup locations for jumps

    # New: fixup locations for calls to virtualized functions
    keyFixups = []

    # New: fixup locations for calls to non-virtualized functions
    binaryRelativeFixups = []

    # Same as before: iterate over all instructions
    for i in insns:

        # Same as before: memorize VM position/key to x86 mapping
        currLen = len(mcArr)
        locsDict[i.Pos] = currLen
        keysDict[i.Key] = currLen

        # New: length of prologue instructions inserted before
        # devirtualized FinSpy VM instruction. Only obtains a
        # non-zero value if this instruction corresponds to the
        # beginning of a virtualized function.   
        prologueLen = 0

        # New: is this VM instruction the beginning of a
        # virtualized function?
        if i.Key in KEY_TO_PROLOGUE_BYTES_DICT:

            # Get the prologue bytes that should be inserted
            # before this VM instruction.
            prologueBytes = KEY_TO_PROLOGUE_BYTES_DICT[i.Key]

            # Increase the length of the instruction.
            prologueLen += len(prologueBytes)

            # Copy the raw x86 machine code for the prologue
            # into the mcArr array before devirtualizing the
            # instruction.
            mcArr.extend(prologueBytes)

        # Now devirtualize the instruction. Handling of
        # "Raw X86", "Indirect Call", and jumps are identical
        # to before, so the code is not duplicated here.

        # Is this an "X86CALLOUT" ("Direct Call")?
        if isinstance(i,RawX86Callout):

            # New: emit 0xE8 (x86 CALL disp32)
            mcArr.append(0xE8)

            # Was the target a non-virtualized function?
            if i.X86Target in NOT_VIRTUALIZED:

                # Emit a fixup from to the raw target
                binaryRelativeFixups.append((i.Pos,prologueLen+1,i.X86Target))

            # Otherwise, the target was virtualized
            else:
                # Emit a fixup to the devirtualized function body
                # specified by the key of the destination
                keyFixups.append((i.Pos,prologueLen+1,i.X86Target))

            # Write the dummy destination DWORD in the x86 CALL
            # instruction that we just generated. This will be
            # fixed-up later.
            mcArr.extend([0x00, 0x00, 0x00, 0x00])

The Python code above generates additional fixup information for devirtualized X86CALLOUT instructions. The two cases of the destination being virtualized or not are handled similarly, though they are placed in two different lists ("keyFixups" for virtualized targets, and "binaryRelativeFixups" for non-virtualized targets). After the main devirtualization loop shown above, we must process the fixups just generated, the same way we did for the jump instructions. The process of applying the fixups is nearly identical to what we did for jump instructions, except that for virtualized targets, we need to determine the VM instruction key corresponding to the x86 address of the X86CALLOUT target. Here is the code for fixing up calls to virtualized functions:

# Fixups contain:
# * srcBegin: beginning of devirtualized CALL instruction
# * srcFixup: distance into devirtualized CALL instruction
#             where displacement DWORD is located
# * dst:      the X86CALLOUT target address
for srcBegin, srcFixup, dst in keyFixups:

    # Find the machine code address for the source
    mcSrc = locsDict[srcBegin]

    # Lookup the x86 address of the target in the information
    # we extracted for virtualized functions. Extract the key 
    # given the function's starting address.
    klDst = X86_VMENTRY_TO_KEY_DICT[dst]
    
    # Find the machine code address for the destination
    mcDst = keysDict[klDst]

    # Set the displacement DWORD within x86 CALL instruction
    StoreDword(mcArr, mcSrc+srcFixup, mcDst-(mcSrc+srcFixup+4))

Next, and more simply, here is the code for fixing up calls to non-virtualized functions:

# Same comments as above
for srcBegin, srcFixup, dst in binaryRelativeFixups:

    # Find the machine code address for the source
    mcSrc = locsDict[srcBegin]
    
    # Compute the distance between the end of the x86
    # CALL instruction (at the address at which it will
    # be stored when inserted back into the binary) and
    # the raw x86 address of the X86CALLOUT target
    fixup = dst-(newImageBase+mcSrc+srcFixup+4)
    
    # Set the displacement DWORD within x86 CALL instruction
    StoreDword(mcArr, mcSrc+srcFixup, fixup)

3. Inspecting the Devirtualization

Now we are in a similar place to where we were after our initial devirtualization attempt in Part #3, Phase #2; let's look at the devirtualized code in IDA and see if anything jumps out as being obviously incorrect.

IDA's navigation bar shows a few things.

take2NavBar.png
  • The first third of the binary -- in the transparently-colored regions -- contains data defined as arrays. IDA has not identified code in these regions.
  • The red-colored areas have properly been indentified as code, but don't have any incoming references, therefore they have not been defined as functions.

These two issues are related: if the regions currently marked as data are actually code, and if they make function calls to the code in red, then perhaps IDA can tell us that the red regions do have incoming references and should be defined as functions. I selected the entire text section, undefined it by pressing 'U', and then selected it again and pressed 'C' to turn it into code. The result was much more pleasing:

take2NavBar-2.png

Now the whole devirtualized blob is defined as code. There is still an obvious cluster of functions that don't have incoming references.

Next we list the remaining issues that appear when inspecting the new devirtualization.

3.1 Some Functions Don't Have Incoming References

As we just saw from the navigation bar, there is a cluster of functions with no incoming references. Furthermore, inspecting these functions shows that they all lack prologues, like we noticed originally for all functions in our first devirtualization. If we turn them into functions, IDA makes its objections well-known with its black-on-red text:

noReferenceNoPrologue.png

So apparently, our prologue extraction scripts have missed these functions. We'll have to figure out why.

3.2 Many Call Instructions Have Invalid Destinations

IDA's "Problems" window (View->Open Subviews->Problems) helpfully points us to another category of errors. Many function calls have unresolved addresses, which IDA highlights as black-on-red text.

nonResolvedCallTargets.png

These issues have an innocuous explanation. In this Phase #4, we made the decision to choose the address 0x500000 as the base address at which to install the devirtualized code within the original binary. The x86 CALL instructions targeting non-virtualized functions are thus computed relative to an address in that region of the binary. Since we are currently inspecting the .bin file on its own, its base address is 0x0, and not 0x500000 like it will be when we insert it the devirtualized code into IDA. The x86 CALL displacements are indeed nonsensical at the moment, but we'll double check on them after we've inserted the devirtualized code back into the binary.

3.3 One Call in Particular is Weird

All of the x86 CALL instructions described in the previous issue have displacements that begin with the nibbles 0xFFF....., indicating that the destination of those CALL instructions lies at an address located physically before the CALL instruction. However, one x86 CALL instruction at the beginning of a devirtualized function has a positive displacement, also colored black-on-red:

seg000:00000E70 sub_E70 proc near
seg000:00000E70     push    0B6Ch
seg000:00000E75     push    40B770h
seg000:00000E7A     call    near ptr 6D85h ; <- bogus destination

I looked at the corresponding function in the original binary from which this prologue had been copied, and the situation became clear.

.text:00404F77         push    0B6Ch
.text:00404F7C         push    offset stru_40B770
.text:00404F81         call    __SEH_prolog
.text:00404F86         xor     esi, esi
.text:00404F88         mov     [ebp-20h], esi
.text:00404F8B         push    edi        ; Save obfuscation register #1
.text:00404F8C         push    ebp        ; Save obfuscation register #1 
.text:00404F8D         mov     ebp, offset word_411A6E ; Junk obfuscation
.text:00404F92         shrd    edi, esi, 0Eh           ; Junk obfuscation

The prologue for the pre-virtualized function installed an exception handler by calling __SEH_prolog. Our prologue extraction script simply copied the raw bytes for the prologue. Since x86 CALL instructions are encoded relative to their source and destination addresses, we can't simply copy a CALL instruction somewhere else without updating the destination DWORD; if we don't, the destination will be incorrect.

Since this issue appeared only once, instead of re-architecting the prologue extraction functionality to deal with this special case, I decided to just manually byte-patch my devirtualized code once I've copied it into the original binary. If I wanted to write a more fully-automated FinSpy devirtualization tool, I would tackle this issue more judiciously.

3.4 What are These Function Pointers?

The second devirtualization contains many pointers that reference hard-coded addresses within the original FinSpy binary from which we extracted the VM bytecode. For example, the following example references a function pointer and an address in the .text section:

seg000:00004BB9     push    0
seg000:00004BBE     push    0
seg000:00004BC3     push    400h
seg000:00004BC8     push    0FFFFh
seg000:00004BCD     call    dword ptr ds:401088h
seg000:00004BD3     mov     eax, ds:41FF38h
seg000:00004BD8     push    0
seg000:00004BDD     call    dword ptr [eax+38h]

Since we are examining the devirtualized code in isolation from the original binary, IDA cannot currently provide us meaningful information about the addresses in question. We can check the addresses in the FinSpy sample IDB to see if they make any sense; for example, here's the address referenced by the CALL: 

.idata:00401088     ; LRESULT __stdcall SendMessageW(HWND hWnd, UINT Msg, WPARAM wParam, LPARAM lParam)
.idata:00401088     extrn SendMessageW:dword

Things look good; we see four arguments pushed in the code above, and the function pointer references a function with four arguments. Once we've inserted our devirtualization back into the original binary, IDA will resolve the references seamlessly, and allow us to make full use of its normal facilities for cross-referencing, naming, type inference, and parameter tracking.

I also noticed that some of the instructions made reference to items within the original binary's .text section. 

seg000:0000333E     mov     dword ptr [esi+4], 4055D5h
seg000:00003345     mov     dword ptr [esi], 40581Eh

; ... later ... 

seg000:000034C4     mov     dword ptr [esi+4], 40593Ch
seg000:000034CB     mov     dword ptr [esi], 4055FEh

; ... later ...

seg000:000034DC     mov     dword ptr [esi+4], 40593Ch
seg000:000034E3     mov     dword ptr [esi], 405972h

; ... more like the above ...

Looking at these addresses in the original binary, I found that they corresponded to virtualized functions in the .text section. For example, here are the contents of the first pointer from the snippet above -- 0x4055D5 -- within the original binary:

.text:004055D5     mov     edi, edi                ; Original prologue
.text:004055D7     push    ebp                     ; Original prologue
.text:004055D8     mov     ebp, esp                ; Original prologue
.text:004055DA     push    ebp                     ; Push obfuscation register #1
.text:004055DB     push    esi                     ; Push obfuscation register #2
.text:004055DC     mov     esi, offset word_41CCBA ; Junk obfuscation
.text:004055E1     mov     ebp, 7C9E085h           ; Junk obfuscation
.text:004055E6     bswap   ebp                     ; Junk obfuscation
.text:004055E8     pop     esi                     ; Pop obfuscation register #2
.text:004055E9     pop     ebp                     ; Pop obfuscation register #1
.text:004055EA     push    5A329Bh                 ; Push VM instruction entry key
.text:004055EF     push    ecx                     ; Obfuscated JMP
.text:004055F0     sub     ecx, ecx                ; Obfuscated JMP
.text:004055F2     pop     ecx                     ; Obfuscated JMP
.text:004055F3     jz      GLOBAL__Dispatcher      ; Enter FinSpy VM

And it turns out that the VM key pushed by this sequence, namely 0x5A329B, references one of the functions in the devirtualized binary which otherwise did not have a incoming reference. Great! We would like to extract the addresses of the pointed-to functions so that we can process them with the scripts we developed in Part #3, Phase #3 in order to extract their prologues. We'd also like to alter the raw x86 instructions that reference the function pointers to make them point to their devirtualized targets within the devirtualized blob instead.

4. Next Step: Function Pointers

At this point, only two issues remain. First, we noticed that some devirtualized functions still don't have prologues. The explanation for this behavior must be that the addresses of their virtualized function stubs must not have been passed to the scripts. If we had provided those virtualized functions' addresses, our scripts would have found something for their prologues, even if it was an incorrect prologue. Yet the scripts found nothing.

Secondly, we noticed that the devirtualized code contained function pointers referencing the addresses of the prologue-lacking functions from the previous paragraph. We would like to replace the raw function pointers within the x86 instructions with the addresses of the corresponding functions in the devirtualized code.

4.1 Extracting Function Pointers from the VM Bytecode Disassembly

It seems like the first step in resolving both issues is to locate the function pointers within the FinSpy VM. I took a look at the raw FinSpy VM instructions from the snippet above with the function pointer references.

Here's the first VM instruction:

0x030630: X86 mov dword ptr [esi+4h], 4055D5h

Here's the raw bytes that encode that VM instruction:

seg000:00030630 dd 5A5C54h ; <- VM instruction key
seg000:00030634 db  1Bh    ; <- Opcode: raw x86
seg000:00030635 db    7    ; <- Length of x86 instruction: 7
seg000:00030636 db    3    ; <- Fixup offset: #3
seg000:00030637 db    0    ; <- Unused
seg000:00030638 db 0C7h    ; <- x86: mov dword ptr [esi+4], 55D5h
seg000:00030639 db  46h    
seg000:0003063A db    4
seg000:0003063B db 0D5h    ; <- 3: offset of 0x55D5 in x86 instruction
seg000:0003063C db  55h
seg000:0003063D db    0
seg000:0003063E db    0

The important thing to notice is that the x86 machine code contained within this instruction disassembles to:

mov dword ptr [esi+4], 55D5h

Whereas the x86 instruction shown in the VM bytecode disassembly listing is, instead:

mov dword ptr [esi+4h], 4055D5h

The difference is in the DWORD value (55D5h in the raw VM bytecode versus 4055D5h in the VM bytecode disassembly). 

The reason for this difference lies in the line labeled "Fixup offset: #3". You may recall from part two that all FinSpy VM instructions have two byte fields at offsets +6 and +7 into the VM instruction structure that were named "RVAPosition1" and "RVAPosition2". To quote the description of those fields from part two:

"Some instructions specify locations within the x86 binary. Since the binary's base address may change when loaded as a module by the operating system, these locations may need to be recomputed to reflect the new base address. FinSpy VM side-steps this issue by specifying the locations within the binary as relative virtual addresses (RVAs), and then adding the base address to the RVA to obtain the actual virtual addresses within the executing module. If either of [RVAPosition1 or RVAPosition2] is not zero, the FinSpy VM treats it as an index into the instruction's data area at which 32-bit RVAs are stored, and fixes the RVA up by adding the base address to the RVA."

In a bit of unplanned, happy serendipity, when I was writing my FinSpy VM bytecode disassembler, I made a Python class called "GenericInsn" that served as the base class for all other Python representations of FinSpy VM instruction types. Its Init() method is called in the constructor for every VM instruction type. And in particular, Init() includes the following code:

if self.Op1Fixup:
    ApplyFixup(self.Remainder, self.Op1Fixup & 0x7F, self.Pos)
if self.Op2Fixup:
    ApplyFixup(self.Remainder, self.Op2Fixup & 0x7F, self.Pos)

Thus, we are in the fortunate position where FinSpy VM helpfully tags all pointers to items in the original binary by setting these RVAPosition1 and RVAPosition2 fields. And furthermore, our existing function "ApplyFixup" already receives all of these values when we disassemble a FinSpy VM bytecode program. Thus, all we need to do to extract the function pointers is to include some logic inside of ApplyFixup that detects when one of these embedded RVAs refers to a function pointer, and if it does, to store the virtual address of the function pointer into a global set. The logic I used to determine function pointers was simply checking whether the virtual address was between the beginning of the first function in the .text section, and the last address in the .text section.

To wit, I changed my implementation of ApplyFixup as follows:

# New: constants describing the first function in the
# .text section and the end of the .text section.
TEXT_FUNCTION_BEGIN = 0x401340
TEXT_FUNCTION_END = 0x41EFC6

# New: a global dictionary whose keys are fixed-up
# virtual addresses, and whose values are lists of 
# VM instruction positions whose bodies reference
# those virtual addresses.
from collections import defaultdict
ALL_FIXED_UP_DWORDS = defaultdict(list)

# Existing ApplyFixup function
def ApplyFixup(arr, FixupPos, InsnPos):
    # New: Python scoping statement
    global ALL_FIXED_UP_DWORDS
    
    # Existing ApplyFixup logic
    OriginalDword = ExtractDword(arr, FixupPos)
    FixedDword = OriginalDword + IMAGEBASE_FIXUP
    StoreDword(arr, FixupPos, FixedDword)
    
    # New: if the fixed-up DWORD is in the .text 
    # section, save it in ALL_FIXED_UP_DWORDS and
    # add the VM instruction position (InsnPos) to
    # the list of positions referencing that DWORD.
    if FixedDword >= TEXT_FUNCTION_BEGIN and FixedDword <= TEXT_FUNCTION_END:
        ALL_FIXED_UP_DWORDS[FixedDword].append(InsnPos)

4.2 Extracting Prologues from Virtualized Function Pointers

Next, I also wanted to treat these virtual addresses as though they were the beginnings of virtualized functions, so that my existing machinery for extracting function prologues would incorporate them. In Part #3, Phase #3, I had written a function called "ExtractCalloutTargets" that scanned the FinSpy VM instructions looking for X86CALLOUT instructions and extracted their target addresses. This was then passed to the function prologue extraction scripts to collect the data that was used in this Phase #4 to devirtualize X86CALLOUT instructions and insert the function prologues from virtualized functions into the devirtualization.

It seemed natural to modify ExtractCalloutTargets to incorporate the virtual addresses we collected in the previous subsection. To wit, I modified that function as such:

# Existing ExtractCalloutTargets function
def ExtractCalloutTargets(insns, vmEntrypoint):
    # New: Python scoping statement
    global ALL_FIXED_UP_DWORDS
    
    # New: initialize the set to the function pointer 
    # addresses collected in ApplyFixup
    calloutTargets = set(ALL_FIXED_UP_DWORDS.keys())
    
    # Existing: add vmEntrypoint to set
    calloutTargets.add(vmEntrypoint)
    
    # Existing: extract X86CALLOUT targets
    for i in insns:
        if isinstance(i,RawX86Callout):
            if i.X86Target not in NOT_VIRTUALIZED:
                calloutTargets.add(i.X86Target)
    
    # Existing: return list of targets
    return list(calloutTargets)

Now I ran the function prologue extraction scripts from Part #3, Phase #3 again, to re-generate the virtualized function prologue and VM instruction entry keys for the function pointers in addition to the existing data for the X86CALLOUT targets. I then pasted the output data back into the second devirtualization program we wrote in this Phase #4 (remembering to copy in the data I'd generated manually for those virtualized functions without junk obfuscation sequences), and ran the devirtualization again. This time, the unreferenced functions had proper prologues, though they were still unreferenced.

4.3 Fixing the Function Pointers in the Devirtualized x86 Code

The last remaining issue is that the devirtualized x86 instructions which reference the function pointers still use the addresses of the virtualized functions in the .text section, whereas we want to modify them to point to their devirtualized equivalents instead. This is implemented in the RebuildX86 devirtualization function after the machine code array for the devirtualized program has been fully generated.

Fortunately for us, we already know which VM instructions reference the function pointers -- we collected that information when we modified ApplyFixup() to locate and log virtualized function pointers. Not only did we log the virtual addresses of the purported function pointers, but we also logged a list of VM instruction positions referencing each such function pointer in the ALL_FIXED_UP_DWORDS dictionary.

4.3.1 A Slight Complication

A slight complication lead me to a solution that perhaps could have been more elegant. Namely, we collect the positions of the VM instructions referencing function pointers within ApplyFixup() at the time that we disassemble the VM bytecode program. However, the simplifications in Part #3, Phase #1 can potentially merge instructions together when collapsing patterns of VM instructions into smaller sequences. Therefore, it might be the case that the VM instruction positions that we have collected no longer refer to valid locations in the VM program after the simplifications have been applied. However, we'd still expect the function pointers to appear in the machine code for the VM instructions into which the removed instruction was merged.

To work around this issue, I made use of the locsDict dictionary that we generated through devirtualization. Namely, that dictionary recorded the offset within the devirtualized x86 blob of each VM instruction processed in the main devirtualization loop. We find the offset within the devirtualized x86 machine code array of the prior VM instruction with an entry within locsDict, and we find the devirtualized offset of the next VM instruction with an entry within locsDict. This gives us a range of bytes to search in the devirtualized machine code looking for the byte pattern corresponding to the function pointer for the virtualized function. Once found, we can replace the raw bytes with the address of the devirtualized function body for that virtualized function.

4.3.2 Locating the Function Pointers in the Devirtualized Blob

Here is the code for locating function pointers as just described; if it is still unclear, read the prose remaining in this subsection.

# dword: the virtual address of a virtualized function
# posList: the list of VM instruction positions 
# referencing the value of dword
for dword, posList in ALL_FIXED_UP_DWORDS.items():
    
    # For each position referencing dword:
    for pos in posList:
        
        # Set the low and high offset within the
        # devirtualized blob to None
        lowPos,highPos = None,None
        
        # posSearchLow is the backwards iterator
        posSearchLow = pos
        
        # Continue while we haven't located a prior
        # instruction with a devirtualization offset
        while not lowPos:
            
            # Does posSearchLow correspond to a 
            # devirtualized instruction? I.e., not
            # something eliminated by a pattern
            # substitution.
            if posSearchLow in locsDict:

                # Yes: get the position and quit
                lowPos = locsDict[posSearchLow]

            else:
                # No: move to the previous instruction
                posSearchLow -= INSN_DESC_SIZE

        # Now search for the next higher VM position
        # with a devirtualization offset
        posSearchHigh = pos+INSN_DESC_SIZE

        # Continue while we haven't located a later
        # instruction with a devirtualization offset
        while not highPos:

            # Does posSearchLow correspond to a 
            # devirtualized instruction? I.e., not
            # something eliminated by a pattern
            # substitution.
            if posSearchHigh in locsDict:
            
                # Yes: get the position and quit
                highPos = locsDict[posSearchHigh]
            else:
                # No: move to the next instruction
                posSearchHigh += INSN_DESC_SIZE

For each instruction position X that references one of the pointers to virtualized functions, I locate the last VM instruction at or before X in the locsDict array. This is implemented as a loop that tries to find X in locsDict. If locsDict[X] exists, we save that value -- the offset of the corresponding devirtualized instruction within the devirtualized blob. If locsDict[X] does not exist, then the VM instruction must have been removed by one of the pattern simplifications, so we move on to the prior VM instruction by subtracting the size of an instruction -- 0x18 -- from X. We repeat until we find an X that has been devirtualized; if X becomes 0x0, then we reach the beginning of the VM instructions, i.e., devirtualized offset 0x0.

We do much the same thing to find the next VM instruction with a corresponding devirtualized offset: add the size of a VM instruction -- 0x18 -- to X and look it up in locsDict. If it's not a member of locsDict, add 0x18 and try again. Once we find it, If X ever exceeds the last legal VM location, set the offset to the end of the machine code array.  Once we've found the next VM instruction's devirtualized position, we record it and stop searching.

4.3.3 Rewriting the Function Pointers

Immediately after the code just shown, we have now found a suitable range within the x86 machine code array that ought to contain the raw bytes corresponding to the virtual address of a virtualized function referenced via pointer. Next we simply byte-search this portion of the array looking for that address, and once found, replace the address with that of the corresponding devirtualized function body. There is nothing especially complicated about this; we simply consult the book-keeping metadata that we gathered through devirtualization to locate the devirtualized offset of the virtualized function pointer, add the offset of the new image base at which we are inserting the devirtualized blob within the binary, and store the DWORD value at the found position within the machine code array.

4.3.4 Done

After writing the code just described, now the pointers to virtualized functions have been modified to point to their devirtualized counterparts. Here again are two references to virtualized functions before the modifications just described:

seg000:00003555     mov     dword ptr [esi+4], 4055D5h
seg000:0000355C     mov     dword ptr [esi], 40581Eh

And, the same code after modification:

seg000:00003555     mov     dword ptr [esi+4], 50154Ah
seg000:0000355C     mov     dword ptr [esi], 5017B3h

5. Inserting the Devirtualized Code back Into the Binary

The last step before we can analyze the FinSpy dropper is to re-insert our devirtualized blob back into the binary. We have already chosen an address for it: 0x500000, which was important in generating the devirtualized code.

At this point I struggled to load the devirtualized code with with IDA's File->Load File->Additional binary file... and Edit->Segments->Create Segment menu selections. Although both of these methods allowed me to load the raw devirtualized machine code into the database, I experienced weird issues with both methods. Namely, the cross-section data references and/or function cross-references were broken. IDA might display the correct addresses for data items, and allow you to follow cross-references by pressing "enter" over an address, but it would not show symbolic names or add cross-references. For example we might see something like this:

.data:00504C3C call    dword ptr ds:401088h

Rather than what we see when things are working properly:

.data:00504C3C call    ds:SendMessageW

I tried screwing with every option in the two dialogs mentioned, especially the segment attributes ("CODE" instead of "DATA"). For some attempts, the code references worked properly but the data references didn't; and for other attempts, the opposite was true. More often neither would work. Igor Skochinsky from Hex-Rays has always been very helpful to me, but this time he was away from his keyboard and did not hear my cries of anguish until it was too late. (Thanks anyway, Igor.)

That being the case, although it wasn't my first choice, I ended up enlarging the .data section via Edit->Segments->Edit Segment and then loading the binary contents with a one-liner in IDC:

loadfile(fopen("mc-take2.bin", "rb"), 0, 0x500000, 26840);

And this time, everything worked. You can see the IDB with the devirtualized code here.

From there I reverse engineered the devirtualized FinSpy dropper program. Whereas I was not impressed with the FinSpy VM, the dropper was more sophisticated than I was expecting. You can see a mostly-complete analysis in the linked IDB; start reading from address 0x50207E, the address of WinMain() within the devirtualized code. I've tried to comment most of the assembly language, but a lot of the action is inside of Hex-Rays (i.e., look at those functions inside of Hex-Rays to see a lot of comments that aren't in the assembly language view).

6. Conclusion 

FinSpy VM is weak. It's closer in difficulty to a crackme than to a commercial-grade VM. (I suppose it is slightly more polished than your average VM crackme.) Having a "Raw x86" instruction in the FinSpy VM instruction set, where those instructions make up about 50% of the VM bytecode program, makes devirtualization trivial. 

I almost didn't publish this series because I personally didn't find anything interesting about the FinSpy VM. But, hopefully, through all the tedium I've managed to capture the trials and tribulations of writing a deobfuscator from scratch. If you're still reading at this point, hopefully you found something interesting about it, and hopefully this slog wasn't all for nothing. Hopefully next time you come across a FinSpy-protected sample, this series will help you make short work of it.

FinSpy VM Unpacking Tutorial Part 3: Devirtualization. Phase #3: Fixing the Function-Related Issues

[Note: if you've been linked here without context, the introduction to Part #3 describing its four phases can be found here.]

1. Introduction

At the end of Part #3, Phase #2, we noted that our first attempt at devirtualization is still subject to two remaining major issues.

  • We had deferred generating proper displacements when devirtualizing the FinSpy VM X86CALLOUT instructions into x86 CALL instructions.
  • We discovered that the functions in the devirtualized code were missing their prologues, since the prologues of virtualized function execute in x86 before entering the VM.

Resolving these issues was the most difficult part of devirtualizing FinSpy, and took about half of the total time I spent on devirtualization. I dreamed up one "nice" solution, and implemented instead one "hacky" solution, but both of them fall short of full automation.

Phase #3, this entry, discusses how FinSpy virtualizes functions and function calls. We illustrate the problems that FinSpy's design decisions present us in properly devirtualizing functions and function calls. We state precisely what problems need to be solved. Then, we discuss several ideas for solving them, and eventually write an IDAPython script to collect the information we need. We finish by attending to some issues that arise in the course of writing and using this script.

Part #3, Phase #4, the next entry, will incorporate this information into the devirtualization process. After fixing a few more issues, our journey in devirtualizing FinSpy will be complete.

2. How FinSpy Virtualizes Functions and Calls

Ultimately, our major remaining task in devirtualizing FinSpy VM bytecode programs is to devirtualize the X86CALLOUT instructions. To do that, we need to attend to the several issues described in Part #3, Phase #2 and in the introduction above. It turns out that these issues arise due to how the FinSpy VM virtualizes functions, and due to the mechanics of the X86CALLOUT VM instruction. 

In looking at the FinSpy VM bytecode, we can see that function calls have been virtualized in a way that is very natural, identical to what we'd expect to see in an x86 binary compiled with ordinary compilation techniques. For example:

0x006ff0: X86 push ebx
0x007020: X86 push dword ptr [ebp+0FFFFFFFCh]
0x007098: X86 push eax
0x0070c8: X86CALLOUT 0x40ae74

This sequence almost looks like an x86 function call sequence already. And for this particular example, if we inspect the code at the destination of the X86CALLOUT instruction -- 0x40ae74 -- we see a normal x86 function body:

.text:0040AE74     ; void *__cdecl memcpy(void *Dst, const void *Src, size_t Size)
.text:0040AE74     memcpy proc near
.text:0040AE74
.text:0040AE74     Dst= dword ptr  4
.text:0040AE74     Src= dword ptr  8
.text:0040AE74     Size= dword ptr  0Ch
.text:0040AE74
.text:0040AE74 000 jmp     ds:__imp_memcpy
.text:0040AE74
.text:0040AE74     memcpy endp

If we were to devirtualize the "X86CALLOUT" VM instruction from above into an x86 CALL instruction to the same location, this is indeed exactly what we would see in a normal binary. The obvious approach to devirtualize the X86CALLOUT instruction in the snippet above would be to replace it with an ordinary x86 CALL instruction targeting the function above, and there seem to be no drawbacks or serious complications with doing so in this case.

However, other X86CALLOUT instructions tell a different tale. Here's another, similar sequence of FinSpy VM instructions:

0x00f570: X86 push 40h
0x00f5a0: X86 push 1000h
0x00f5d0: X86 push eax
0x00f600: X86 push esi
0x00f630: X86CALLOUT 0x408810

In this example, at the location specified in the X86CALLOUT instruction -- 0x408810 -- we do not see an ordinary x86 function. Rather, like we discussed in part one, we see that the original, pre-virtualized function has been overwritten by a sequence of code that ultimately enters the FinSpy VM. To re-state: virtualized functions still reside at their original addresses in the binary, and can be executed by calling that location as usual; however, virtualized functions have been modified to transfer control to the suitable location inside of the VM bytecode program. (I suspect the FinSpy authors chose to retain virtualized function addresses in order to preserve certain metadata in the PE64 header surrounding exception records and function start addresses.) The x86 code at the location from above shows:

.text:00408810     mov     edi, edi                ; Ordinary prologue #0
.text:00408812     push    ebp                     ; Ordinary prologue #0
.text:00408813     mov     ebp, esp                ; Ordinary prologue #0
.text:00408815     push    ecx                     ; Ordinary prologue #0
.text:00408816     push    ecx                     ; Ordinary prologue #0
.text:00408817     push    eax                     ; Save obfuscation register #1.1
.text:00408818     push    ebx                     ; Save obfuscation register #2.1
.text:00408819     mov     ebx, offset unk_41B164  ; Junk obfuscation
.text:0040881E     mov     eax, 0B3BF98Dh          ; Junk obfuscation

; ... more junk obfuscation ...

.text:0040883E     bswap   eax                     ; Junk obfuscation
.text:00408840     stc                             ; Junk obfuscation
.text:00408841     pop     ebx                     ; Restore obfuscation register #2.2
.text:00408842     pop     eax                     ; Restore obfuscation register #1.2
.text:00408843     push    5A7314h                 ; Push VM instruction entry key #3
.text:00408848     push    eax                     ; Obfuscated JMP
.text:00408849     xor     eax, eax                ; Obfuscated JMP
.text:0040884B     pop     eax                     ; Obfuscated JMP
.text:0040884C     jz      GLOBAL__Dispatcher      ; Enter FinSpy VM #4

As in the code above, virtualized functions have been overwritten by sequences of x86 instructions that do up to four things.

  1. Execute the original prologue of the pre-virtualized function (on the lines labeled #0 above)
  2. After saving two registers on the lines labeled #1.1 and #2.1, perform junk obfuscation (meaningless computations), and then restore the values of those registers on the lines labeled #2.2 and #1.2.
  3. Push the VM instruction key for the virtualized function body onto the stack (on the line labeled #3 above)
  4. Jump to the FinSpy VM interpreter (on the line labeled #4 above)

The most important observations from the code above are:

  1. Whenever an X86CALLOUT instruction targets the x86 location 0x408810, the result is that the VM begins executing VM instructions starting with the one whose key is 0x5A7314.
  2. For the virtualized function at x86 location 0x408810 (at the VM instruction keyed 0x5A7314), the virtualized function's prologue is the first five x86 instructions from the sequence above (all of which are labeled #0).

2.1 Comments on Devirtualization Strategy

In discussing X86CALLOUT VM instructions to non-virtualized targets, we suggested that we could devirtualize them into an x86 CALL instruction directly targeting the specified location. However, that strategy will not produce good results when the targeted address is a virtualized function. If we were to devirtualize the X86CALLOUT instruction in the second example above with an x86 CALL instruction to the second targeted function, our resulting "devirtualization" would still contain obfuscation and references to the VM. I.e., upon encountering an x86 CALL instruction in the "devirtualized" code, we as analysts would have to analyze the x86 code shown above to determine which VM instruction ended up executing as a result, and to inspect the prologue for the targeted function, which would not be present at the site of the devirtualized function body. This is hardly a "devirtualization", given that we would still need to analyze obfuscated code involving the FinSpy VM, and that IDA and Hex-Rays will balk at functions with no prologues.

Therefore, to truly "devirtualize" FinSpy VM programs, we need to replicate what happens when a virtualized function is called: namely, we need to replicate the original function's prologue from before the VM entry sequence, and also determine the VM location at which the virtualized function's body resides, in order to emit an X86 CALL instruction from the site of the X86CALLOUT VM instruction to the devirtualized address of the destination, thereby entirely eliminating reliance on the FinSpy VM.

Hence, it is clear that we need two different strategies for devirtualizing X86CALLOUT instructions. For non-virtualized targets, we could simply emit x86 CALL instructions to the destination. For virtualized targets, we would need to determine the VM address of the VM bytecode translation for the function, locate the devirtualized versions of those VM instructions within our devirtualized array, and replace the X86CALLOUT VM instruction with an x86 CALL instruction pointing to the proper location within the devirtualized code.

Additionally, for each virtualized function, we need to extract its function prologue from the .text section, and insert those instructions before the devirtualized body of the corresponding function.

3. Stating Our Task Precisely

To devirtualize X86CALLOUT instructions, we need the following information:

  • A list of all x86 locations used as call targets, and whether or not the functions at those locations are virtualized.
  • For each virtualized function:
    • The VM instruction key pushed before entering the VM
    • The raw machine code comprising the function's prologue

With this information, we could solve our remaining issues as follows:

  • When devirtualizing any FinSpy VM instruction, look up its VM instruction key to see if it's the first VM instruction implementing a virtualized function body. If so, insert the prologue bytes from the corresponding x86 function in the .text section before devirtualizing the instruction as normal.
  • When devirtualizing X86CALLOUT instructions, check to see whether the destination is a virtualized function or not. 
    • If the destination is virtualized, emit an x86 CALL instruction whose displacement points to the x86 address of the devirtualized function body within the blob of devirtualized code. 
    • If the destination is not virtualized, emit an X86 CALL instruction pointing to the referenced location in the .text section. This requires knowledge of the base address at which the devirtualized code shall be stored in the binary containing the FinSpy VM.

3.1 Challenges in Obtaining the Requisite Information

Unfortunately for us, we've got a bit of work ahead of us, since the FinSpy VM does not readily provide the information we're interested in. 

  • The FinSpy VM metadata does not contain a list of called function addresses (virtualized or not). We have to perform our own analysis to determine which x86 functions may be called through VM execution, and whether or not the called functions are virtualized. 
  • The FinSpy VM makes no distinction between the cases where the destination address is virtualized, and the case in which it is not virtualized. In both cases, the target of an X86CALLOUT location is simply an address in the .text section. If the target is virtualized, then there will be a FinSpy VM entry sequence at the destination. If the target is not virtualized, there will not be a FinSpy VM entry sequence at the destination. Thus, the onus is upon us to determine whether a particular call target is virtualized or not, and if it is, to extract its function prologue and determine the VM key of the VM instruction that implements the virtualized function's body.

4. Initial Approach to Discovering Virtualized Function Addresses

Now that our tasks are laid out, let's set about solving them. For the first task -- obtaining the list of virtualized function addresses -- my first thought was to extract the targets from all of the X86CALLOUT instructions. That idea was easy enough to implement. I wrote a small Python script to dump all of the X86CALLOUT targets from the FinSpy VM bytecode program:

# Iterate through the VM instructions and extract direct call targets
# Inputs:
# * insns: a list of VM instruction objects
# * vmEntrypoint: the address of WinMain() in the original binary
# Output:
# * A list of call targets
def ExtractCalloutTargets(insns, vmEntrypoint):

    # Create a set containing just the address of the VM entrypoint
    calloutTargets = set([vmEntrypoint])

    # Iterate through all VM instructions
    for i in insns:
        # Was the instruction an X86CALLOUT?
        if isinstance(i,RawX86Callout):
            # Add it to the set
            calloutTargets.add(i.X86Target)

    # Return a list instead of a set
    return list(calloutTargets)

We add the address of the VM entrypoint because it isn't explicitly called from anywhere within the VM program -- WinMain() contains a VM entry sequence that causes it to execute.

The code above was a good start toward obtaining the list of x86 functions that may be called by virtualized code, and as far as I knew at this point, this list contained all such function addresses. I later discovered that some virtualized functions are not referenced via X86CALLOUT instructions (analogously to how WinMain()'s virtualized entrypoint is not the target of an X86CALLOUT instruction), and hence are not included in the list of virtualized functions generated above. Later it became clear that not including those virtualized function addresses not referenced by X86CALLOUT instructions causes serious problems while collecting the function information in preparation for devirtualization. Still, all of those problems were yet to materialize; this was my initial, blissfully ignorant approach.

5. A Nice Approach to Extracting Information from Virtualized Functions

For extracting the VM entry keys and function prologues, the first solution that came to mind was the best one I came up with. It is not, however, what I ended up actually doing.

Some modern reverse engineering tools (such as the Unicorn Engine) support custom emulation of assembly language snippets (as opposed to full-system emulation). The user supplies a starting address and an initial state for the registers and memory. From there, the emulation is controllable programmatically: you can emulate one instruction at a time and inspect the state after each to determine when to stop. (My own program analysis framework, Pandemic, part of my SMT training class, also supports this functionality.)

With access to a customizable x86 emulator, and assuming that we knew the address of the VM interpreter, we could extract the VM entry instruction keys for a virtualized function as follows:

  • Put the emulator's registers and memory into some initial state.
  • Set the initial x86 EIP to the beginning of the virtualized function's x86-to-VM entrypoint.
  • Emulate instructions until EIP reaches the address of the VM interpreter. Save each emulated instruction into a list.
  • Extract the DWORD from the bottom of the stack. This is the VM key corresponding to the beginning of the function.
  • Scan the list of emulated instructions in reverse order to determine which two registers are being used for junk obfuscation.
  • Scan the list of emulated instructions in forward order until the point at which those two registers are pushed. The instructions before these two x86 PUSH instructions comprise the prologue for the function beginning at the starting address.    

This is the best solution I have come up with so far, which mirrors the approaches I've taken for similar problems arising from different obfuscators. The emulation-based solution is very generic. For the task of recovering the VM entry key for a given entrypoint, it uses a semantic pattern -- no matter how the code at the VM entrypoint is implemented, the end result is that the VM entry key is pushed on the stack before the VM begins executing. Semantic pattern-matching is preferable in the extreme to syntactic pattern-matching. It would not matter if the FinSpy authors change the obfuscation at the virtualized functions, so long as the fundamental architecture of VM entry remains the same. I expect that this method would continue to work until and unless there was a major overhaul of the FinSpy VM entry schema.

The logic for extracting the function prologues is based on syntactic pattern-matching. Therefore it is more brittle, and would require tweaking if the FinSpy VM authors changed the VM entrypoint obfuscation.

The reason I did not pursue the emulation-based solution is not especially interesting: I had just gotten a new laptop and had not installed my development environment at that time, and I wanted a quick solution. Anyway, even if I had, I'm not sure I would have released the code for it. While staring at build environment errors, I started to wonder if there was another way to obtain the x86 call target/VM key information. What I came up to replace the VM entry key extraction did work, but in all fairness, it wasn't a very good solution and is not suitable for a fully-automated solution, since it does involve some manual work.

6. Hacky Solution, Overview

Remember, our overall goal is to discover, for each virtualized function: 

  1. The key for the VM instruction implementing the virtualized function's body
  2. The non-virtualized prologue instructions for the virtualized function

In lieu of the nicer, emulation-based solution, the hacky solution I came up with uses the IDA API to extract information in several separate parts before eventually combining them. The entire script can be found here.

  1. First, we find all x86 locations that jump to the FinSpy VM interpreter.
  2. Second, for each such referencing address, we extract the key pushed shortly beforehand, and also extract the names of the registers used by the junk obfuscation following the non-virtualized function prologue.
  3. For each virtualized function start address, match it up with the subsequent address that enters the VM (i.e., match it with one of the addresses described in #1). From step #2, we know which VM key is pushed before entering the VM interpreter; thus, we now know which VM key corresponds to the function start address. We also know which registers are used for the junk obfuscation for the virtualized function beginning at that address.
  4. Now that we know the identities of the registers used in junk obfuscation for a given virtualized function, scan forwards from its starting address looking for the beginning of the junk obfuscation -- i.e., two consecutive x86 PUSH instructions pushing those register values. Copy the raw bytes before the beginning of the junk obfuscation; these are the prologue bytes.
  5. Correlate the addresses of the virtualized functions with the prologue bytes and VM instruction key extracted in previous steps.

6.1 Steps #1 and #2: Extract VM Entry Keys and Obfuscation Registers

The implementation for the first two steps just described is not very sophisticated or interesting. The first function, ExtractKey, takes as input the address of an instruction that jumps to the VM entrypoint. I.e., its input is the address of an instruction such as the one labeled #4 below:

; ... prologue, junk obfuscation above this ...
.text:004083FC     pop     eax                     ; Pop obfuscation register #2.2
.text:004083FD     pop     ebx                     ; Pop obfuscation register #1.2
.text:004083FE     push    5A6C26h                 ; Push VM instruction key -- #3
.text:00408403     push    eax                     ; Obfuscated JMP
.text:00408404     xor     eax, eax                ; Obfuscated JMP
.text:00408406     pop     eax                     ; Obfuscated JMP
.text:00408407     jz      GLOBAL__Dispatcher      ; Enter FinSpy VM #4

From there, the script disassembles instructions backwards, up to some user-specifiable amount, and inspects them one-by-one looking for the first x86 PUSH instruction (i.e., the one on the line labeled #3 above) that pushes the VM key of the first instruction in the virtualized function's body. 

Once it finds the x86 PUSH instruction on line #3, it inspects the previous two x86 instructions -- those on lines #1.2 and #2.2 -- to see if they are x86 POP instructions, corresponding to the restoration of the registers the VM entry sequences use for obfuscation.

If all checks pass, the script returns a 4-tuple containing:

  • The address of the branch to the VM (i.e., that of line #4 above) 
  • The VM key DWORD (from line #3, e.g. 0x5A6C26 in the above)
  • The two x86 register names from line #1.2 and #2.2. 

That code is shown below (excerpted from the complete script):

# Given an address that references the VM dispatcher, extract
# the VM instruction key pushed beforehand, and the names of
# the two registers used for junk obfuscation. Return a tuple
# with all information just described.
def ExtractKey(vmXref):
    currEa = vmXref
    Key = None
    
    # Walk backwards from the VM cross-reference up to a 
    # specified number of instructions.
    for _ in xrange(MAX_NUM_OBFUSCATED_JMP_INSTRUCTIONS):
        
        # Is the instruction "PUSH DWORD"?
        if idc.GetMnem(currEa) == "push" and idc.GetOpType(currEa, 0) == o_imm:
            
            # Extract the key, exit loop
            Key = idc.GetOperandValue(currEa, 0)
            break
        
        # Otherwise, move backwards by one instruction
        else:
            currEa = idc.PrevHead(currEa, 0)
    
    # After looping, did we find a key?
    if Key is not None:
        # Extract the first operands of the two subsequent instructions
        prevEa1 = idc.PrevHead(currEa,  0)
        prevEa2 = idc.PrevHead(prevEa1, 0)
        
        # Were they pop instructions?
        if idc.GetMnem(prevEa1) == "pop" and idc.GetMnem(prevEa2) == "pop":
            # Return the information we just collected
            return (vmXref,Key,idc.GetOpnd(prevEa1,0),idc.GetOpnd(prevEa2,0))
        
        # If not, be noisy about the error
        else:
            print "%#lx: found key %#lx, but not POP reg32, inspect manually" % (xref, Key)
            return (vmXref,Key,"","")
    
    # Key not found, be noisy
    else:
        print "%#lx: couldn't locate key within %d instructions, inspect manually" % (xref,MAX_NUM_OBFUSCATED_JMP_INSTRUCTIONS)
        return None

There is a second function, ExtractKeys, which iterates over all cross-references to the VM entrypoint, and calls ExtractKey for each. It is not interesting, and so the code is not reproduced in this document, though it is in the included source code.

The results of ExtractKeys -- the tuples from above -- are then saved in a Python variable called locKey. 

locKey = ExtractKeys(0x00401950)

This script can go wrong in several ways. Some of the references to the VM entrypoint might not have been properly disassembled, and so those references won't be in the set returned by IDA's cross-reference functionality. Secondly, if the FinSpy VM authors modified their virtualized entrypoint obfuscation strategy, it might necessitate changes to the strategy of simply walking backwards. Also, I found out later that not every x86-to-VM entry sequence used junk obfuscation, so the pattern-matching looking for the two x86 POP instructions failed. But, we're getting ahead of ourselves; I found and fixed those issues later on.

6.2 Step #3: Correlating Virtualized Function Beginnings with VM Entrypoints

Now that we have information about each location that enters the VM, we need to correlate this information with the list of X86CALLOUT targets corresponding to virtualized functions. I.e., given an address that is targeted by an X86CALLOUT instruction, we want to determine which address will subsequently transfer control into the VM (i.e., one of the addresses inspected in the previous steps). To assist in explanation, an example of a VM entry sequence is shown.

.text:00408360     mov     edi, edi                ; Original function prologue #0
.text:00408362     push    ebp                     ; Original function prologue #0
.text:00408363     mov     ebp, esp                ; Original function prologue #0
.text:00408365     sub     esp, 320h               ; Original function prologue #0
.text:0040836B     push    ebx                     ; Original function prologue #0
.text:0040836C     push    edi                     ; Original function prologue #0
.text:0040836D     push    ebx                     ; Push obfuscation register #1.1
.text:0040836E     push    eax                     ; Push obfuscation register #2.1

; ... junk obfuscation not shown ... 

.text:004083FC     pop     eax                     ; Pop obfuscation register #2.2
.text:004083FD     pop     ebx                     ; Pop obfuscation register #1.2
.text:004083FE     push    5A6C26h                 ; Push VM instruction key -- #3
.text:00408403     push    eax                     ; Obfuscated JMP
.text:00408404     xor     eax, eax                ; Obfuscated JMP
.text:00408406     pop     eax                     ; Obfuscated JMP
.text:00408407     jz      GLOBAL__Dispatcher      ; Enter FinSpy VM #4

In the previous section, we extracted information about each location -- such as the address labeled #4 above -- that enters the VM. Namely, we extract the VM instruction key for the virtualized function body from the line labeled #3, and the names of the two registers used for obfuscation on the lines labeled #2.2 and #1.2.

Now, given the beginning of a virtualized function's VM entrypoint -- such as the first address above labeled #0 -- we want to know the address of the instruction that ultimately transfers control into the VM, the one labeled #4 in the example above. Once we know that, we can look up the address of that instruction within the information we've just collected, which will then tell us which two registers are used for the junk obfuscation (the ones popped on the lines labeled #2.2 and #1.2 -- namely, EAX and EBX). From there, we can scan forward in the prologue (the instructions labeled #0 above) until we find x86 PUSH instructions that save those two registers before the junk obfuscation begins (namely the x86 PUSH instructions on the lines labeled #1.1 and #2.1 above). Once we find those two registers being pushed in that order, we know that we've reached the end of the prologue. Therefore, every instruction leading up to that point is the virtualized function's prologue. We also know the VM instruction key for the first instruction in the virtualized function's body, the one labeled #3 in the sequence above.

Correlating virtualized function addresses with VM entry addresses is simple. Since there is no control flow in the junk obfuscation, given the address of a virtualized function's entrypoint, the address of the sequentially-next JZ instruction that enters the VM is the corresponding VM entry address.

Therefore, I chose to sort the VM entry information from the previous step -- called locKey -- by the address of the JZ instruction, and stored the sorted list in a Python variable called sLocKey:

sLocKey = sorted(locKey, key=lambda x: x[0])

And then I wrote a small function that, given the start address for a virtualized function, iterates through sLocKey and finds the next greater address that enters the VM, and returns the corresponding tuple of information about the VM entry sequence.

# Given:
# * ea, the address of a virtualized function
# Find the entry in sLocKey whose VM entry branch
# location is the closest one greater than ea
# Ouput:
# The tuple of information for the next VM entry
# instruction following ea
def LookupKey(ea):
    global sLocKey
    for i in xrange(len(sLocKey)):
        if sLocKey[i][0] < ea:
            continue
        return sLocKey[i]
    return sLocKey[i-1]

Now by passing any virtualized function start address into the LookupKey function above, we will obtain the VM key and junk obfuscation register information from the next-subsequent address after the start address that enters the VM.

Two functions collate the virtualized function addresses with the register data:

# Given the address of a virtualized function, look up the VM key and
# register information. Return a new tuple with the virtualized function
# start address in place of the address that jumps to the VM interpreter.
def CollateCalloutTarget(tgt):
    assocData = LookupKey(tgt)
    return (tgt, assocData[1], assocData[2], assocData[3])

# Apply the function above to all virtualized function addresses.
def CollateCalloutTargets(targets):
    return map(CollateCalloutTarget, targets)

The only thing that can go wrong here is if we haven't located all of the JZ instructions that enter the VM. If we don't, then the information returned will correspond to some other virtualized function -- which is a real problem that did happen in practice, and required some manual effort to fix. Those issues will be discussed later when they arise.

6.3 Step #4: Extract Prologues for Virtualized Functions

At this point, for every virtualized function's starting address, we have information about the registers used in the junk obfuscation, as well as the VM instruction key for the virtualized function body. All that's left to do is extract the x86 function's prologue.

This is a very simple affair using standard pattern-matching tricks, very similar to the techniques we used to extract the VM instruction key and junk obfuscation register names. We simply iterate through the instructions at the beginning of a function, looking for two x86 PUSH instructions in a row that push the two registers used in junk obfuscation. (I noticed that the first junk instruction after the two x86 PUSH instructions was "mov reg2, address", where "address" was within the binary. I added this as a sanity check.) The very simple code is shown below (excerpted from the complete script).

# Given:
# * CallOut, the target of a function call
# * Key, the VM Instruction key DWORD pushed
# * Reg1, the name of the first obfuscation register
# * Reg2, the name of the second obfuscation register
# Extract the prologue bytes and return them.
def ExtractPrologue(CallOut, Key, Reg1, Reg2):
    
    # Ensure we have two register names.
    if Reg1 == "" or Reg2 == "":
        return (Key, CallOut, [])
    
    currEa = CallOut
    
    # Walk forwards from the call target.
    for i in xrange(MAX_NUM_PROLOG_INSTRUCTIONS):
        
        # Look for PUSH of first obfuscation register.
        if idc.GetMnem(currEa) == "push" and idc.GetOpnd(currEa, 0) == Reg1:
            nextEa = idc.NextHead(currEa, currEa+16)

            # Look for PUSH of second obfuscation register.
            if idc.GetMnem(nextEa) == "push" and idc.GetOpnd(nextEa, 0) == Reg2:
                thirdEa = idc.NextHead(nextEa, nextEa+16)

                # Sanity check: first junk instruction is "mov reg2, address"
                if idc.GetMnem(thirdEa) == "mov" and idc.GetOpnd(thirdEa, 0) == Reg2:
                    destAddr = idc.GetOperandValue(thirdEa, 1)
                    
                    # Was "address" legal?
                    if destAddr <= PROG_END and destAddr >= PROG_BEGIN:
                        return (Key, CallOut, [ idc.Byte(CallOut + j) for j in xrange(currEa-CallOut) ])
                    
                    # If not, be noisy
                    else:
                        print "# 0x%08lx/0x%08lx: found push %s / push %s, not followed by mov %s, address" % (CallOut, currEa, Reg1, Reg2, Reg2)
                        pass

        # Move forward by one instruction
        currEa = idc.NextHead(currEa, currEa+16)

    # If we didn't find the two PUSH instructions within some
    # specified number, be noisy.
    print "# 0x%08lx: did not find push %s / push %s sequence within %d instructions" % (CallOut, Reg1, Reg2, MAX_NUM_PROLOG_INSTRUCTIONS)
    return (Key, CallOut, [])

Now we have all of the information we need to devirtualize X86CALLOUT instructions properly. One final function collates the information for virtualized function entrypoints with the information collected for jump instructions into the VM:

# Extract the prologues from all virtualized functions.
def GetPrologues(calloutTargets):
    return map(lambda data: ExtractPrologue(*data),CollateCalloutTargets(calloutTargets))

6.4 All Together

First, we run our script to extract the targets of the FinSpy VM X86CALLOUT instructions. This script uses the VM bytecode disassembler, which runs outside of IDA. Thus, we take the output of this script, and copy and paste it into the IDAPython script we developed above to extract function information.

Next, inside of the IDA database for the FinSpy sample, we run our scripts above. They first extract the VM entry instruction information, and then use the X86CALLOUT targets generated by the previous scripts to extract the function prologue and VM entry key for each virtualized function. We print that information out, and copy and paste it into the devirtualization program.

A portion of the output is shown below; the full data set can be seen in the complete Python file:

(0x5a4b3a, 0x406a02, [139, 255, 85, 139, 236, 81, 81, 83, 86, 87]),
(0x5a19e6, 0x40171c, [85, 139, 236]),
(0x5a7a1d, 0x408e07, [139, 255, 85, 139, 236, 81, 131, 101, 252, 0]),
(0x5a7314, 0x408810, [139, 255, 85, 139, 236, 81, 81]),
(0x5a8bf9, 0x409a11, [139, 255, 85, 139, 236, 83, 86, 87, 179, 254]),

Each tuple contains:

  1. The VM instruction key for the first instruction of the virtualized function's body
  2. The x86 address of the virtualized function
  3. A list of x86 machine code bytes for the virtualized function's prologue

6.5 Issues in Collecting Function Information

The goal of the script detailed in pieces above is to collect the VM instruction keys, junk obfuscation register names, and function prologues for each virtualized function. Ultimately we will use this information to devirtualize X86CALLOUT instructions and prepend the prologues to the devirtualized versions of the virtualized functions. The scripts above assist in substantially automating this process, but it still requires manual intervention if any of its assumptions are violated. We can detect these erroneous situations and manually edit the data. Below we discuss the failure cases for the scripts above.

(The scripts just created are the primary reason my approach is "semi-automated" and not "fully-automated".)

6.5.1 Issue #1: Not All Referenced Callout Targets Were Defined as Code

First, not every address extracted as the target of an X86CALLOUT instruction was defined as code in the IDA database for the FinSpy VM sample. This lead to two issues. First, the script for extracting the prologue for that location would fail. Second, since the subsequent reference to the VM entrypoint was consequently also not defined as code, that reference would not be included in the set of addresses generated by the script for extracting the key and register sequence. 

This situation was easy to identify. The script for extracting the prologue would give an error about not being able to find the PUSH instructions for the two obfuscation registers. I inspected the locations for which the prologue script failed, and if that location was not defined as code, I manually defined the locations as code and ran the scripts again. Thereafter, the scripts would properly process these locations automatically.

6.5.2 Issue #2: Not Every Virtualized Function Used the Same VM Entry Schema

Second, the FinSpy VM did not always generate identical schema for x86-to-VM entrypoints at the sites of virtualized functions. Since the FinSpy virtualization obfuscator tool overwrites the original function with a VM entry sequence, small functions might not provide enough space for all parts of the obfuscation sequences. Either there would be no junk obfuscation sequence after the prologue, or the JMP to the VM interpreter would not be obfuscated as an XOR REG, REG / JZ sequence. Also, small functions might not have prologues. 

The script to extract virtualized function VM key / obfuscation register information would fail for these functions. Two errors are shown, as well as the corresponding code at the erroneous locations.

0x408412: found key 0x5a6d38, but not POP reg32, inspect manually
0x408d17: found key 0x5a7952, but not POP reg32, inspect manually

.text:0040840D         push    5A6D38h
.text:00408412         jmp     GLOBAL__Dispatcher

.text:00408D0C         mov     edi, edi
.text:00408D0E         push    5A7952h
.text:00408D13         push    ecx
.text:00408D14         xor     ecx, ecx
.text:00408D16         pop     ecx
.text:00408D17         jz      GLOBAL__Dispatcher

Our ultimate goal with this script is to collect key and prologue information for all virtualized functions. Automation has failed us, because our assumption that each x86-to-VM entrypoint had the same format was wrong. Thus, for these functions, I manually collected the information for these functions. In particular, I added eight manually-created entries to the list generated by the scripts; the first two shown below correspond to the examples above. (For the second entry, the prologue bytes [0x8B, 0xFF] correspond to the "mov edi, edi" instruction on line 0x408D0C above.)

(0x5A6D38,0x40840D,[]),
(0x5A7952,0x408D0C,[0x8B,0xFF]),
(0x5A2A19,0x405022,[0x8B,0x65,0xE8,0xC7,0x45,0xC0,0x01,0x00,0x00,0x00,0x83,0x4D,0xFC,0xFF,0x33,0xF6]),
(0x5A3FA0,0x4060E6,[]),
(0x5A6841,0x408053,[]),
(0x5A6958,0x408107,[]),
(0x5A6AE9,0x408290,[]),
(0x5A6ED6,0x40851C,[0x8B,0xFF,0x55,0x8B,0xEC]),

6.5.3 Issue #3: Not All Callout Targets Were Virtualized Functions

Third, not all of the targets of X86CALLOUT instructions were virtualized -- ten addresses used as X86CALLOUT targets were not virtualized. This included a handful of C runtime functions for string manipulation and exception handling support, but also a few important functions used by the virtualized program. These functions were easy to identify since the prologue extraction script would fail for them. The script issued ten errors, the first three of which are shown:

# 0x0040a07c: did not find push ebp / push edx sequence within 20 instructions
# 0x0040ae80: did not find push ebp / push edx sequence within 20 instructions
# 0x0040709e: did not find push ecx / push edx sequence within 20 instructions

I inspected these addresses manually, and upon determining that the functions weren't virtualized, I created a Python set called NOT_VIRTUALIZED containing the addresses of these functions. 

NOT_VIRTUALIZED = set([
0x0040a07c,
0x0040ae80,
0x0040709e,
0x0040ae74,
0x0040aec7,
0x004070d8,
0x00407119,
0x00401935,
0x00408150,
0x00407155,
])

Then, in my second devirtualization attempt in Part #3, Phase #4, I used this set to determine whether or not to emit an x86 CALL instruction directly to the referenced target.

7. Conclusion

In Phase #3, we examined FinSpy's mechanism for virtualizing functions and function calls. We determined that we would need several pieces of information to devirtualize these elements correctly, and then wrote scripts to collect the information. We attended to issues that arose in running the scripts, and ended up with the data we needed for devirtualization.

In the next and final phase, Part #3, Phase #4, we will incorporate this information into devirtualization. After fixing a few remaining issues, we will have successfully devirtualized our FinSpy VM sample.

FinSpy VM Unpacking Tutorial Part 3: Devirtualization. Phase #2: First Attempt at Devirtualization

[Note: if you've been linked here without context, the introduction to Part #3 describing its four phases can be found here.]

1. Introduction

In the previous Part #3, Phase #1, we inspected our FinSpy VM bytecode disassembly listing and discovered that the Group #2 instructions were used for obfuscation. After discovering obfuscation patterns and replacing them with simpler sequences, we obtained a simpler FinSpy VM bytecode program without any Group #2 instructions. After some further small improvements to the FinSpy VM bytecode disassembly process, we resume with a FinSpy VM bytecode listing that is suitable for devirtualization.

This Phase #2 discusses our first attempt at devirtualization. In fact, given the work done heretofore, the devirtualization code comes to about 100 lines of thoroughly-commented Python code. We then inspect our devirtualization, and discover several remaining issues that require correction before our task is complete. This phase fixes one of them, and the subsequent Part #3, Phase #3 examines the genesis of the remaining issues before fixing them. Part #3, Phase #4 makes a second (and eventually successful) approach toward devirtualizing FinSpy VM bytecode programs.

2. Whole-Program Devirtualization, First Attempt

After the previous Part #3, Phase #1 substitutions, our remaining FinSpy VM bytecode contains only Group #3 VM instructions (containing raw x86 machine code) and Group #1 VM instructions (all 16 varieties of x86 conditional branch instructions, and the now-correctly-identified unconditional JMP VM instructions). The following snippet is fairly representative of our FinSpy VM bytecode program at present. It contains only "Raw X86" instructions, "X86CALLOUT", "X86JUMPOUT", and conditional/unconditional branch instructions -- the only categories of remaining VM instructions after the previous phase. It basically looks like x86 already, except the control flow instructions are FinSpy VM instructions instead of x86 instructions. 

0x008e50: X86 mov ebx, edi
0x008e80: JMP VM[0x008aa8]
0x008e98: X86 push 2E50340Bh
0x008ec8: X86 push dword ptr [420358h]
0x008f28: X86CALLOUT 0x408360
0x008f40: X86 test eax, eax
0x008f58: JZ VM[0x009108] (fallthrough VM[0x008f70])
0x008f70: X86 lea ecx, dword ptr [ebp+0FFFFFFFCh]
0x008fd0: X86 push ecx
0x009000: X86 push 0FFFFFFFFh
0x009030: X86JUMPOUT jmp eax
0x009048: X86 test eax, eax
0x009060: JZ VM[0x009108] (fallthrough VM[0x009078])
0x009078: X86 cmp dword ptr [ebp+0FFFFFFFCh], 0h
0x009090: JZ VM[0x009108] (fallthrough VM[0x0090a8])
0x0090a8: X86 xor eax, eax
0x0090c0: X86 inc eax
0x0090d8: X86 leave 
0x0090f0: X86 ret 
0x009108: X86 xor eax, eax
0x009120: X86 leave 
0x009138: X86 ret 

2.1 Instruction-By-Instruction Devirtualization

At this point -- very quickly and easily into the analysis of the FinSpy VM bytecode program -- I felt comfortable writing a tool to reconstruct an x86 machine code program from the VM bytecode program. (Perhaps I was too comfortable, considering that a lot of work remained after my first attempt.) All of the remaining instructions seemed amenable to one-by-one translation back into x86. Namely, I wrote a simple loop to iterate over each VM instruction and create an x86 machine code array for the devirtualized program. At this point, there are four cases for the remaining VM instructions: the three varieties of Group #3 instructions, and the Group #1 branch instructions. We show simplified code for the devirtualizer, and then discuss the cases for the instruction types in more detail.

# Given: insns, a list of FinSpy VM instructions
# Generate and return an array of x86 machine code bytes for the VM program
def RebuildX86(insns):
    # Array of x86 machine code, built instruction-by-instruction
    mcArr  = []
    
    # Bookkeeping: which VM position/key corresponds to which
    # position within the x86 machine code array mcArr above
    locsDict = dict()
    keysDict = dict()
    
    # List of fixups for branch instructions
    locFixups = []
    
    # Iterate through the FinSpy VM instructions
    for i in insns:
        
        # currLen is the current position within mcArr
        currLen = len(mcArr)
        
        # Bookkeeping: memorize the x86 position for the 
        # VM instruction's VM position and VM key 
        locsDict[i.Pos] = currLen
        keysDict[i.Key] = currLen

        # Is it "Raw X86" or "X86JUMPOUT"? Just emit the
        # raw x86 machine code if so
        if isinstance(i,RawX86StraightLine):
            mcArr.extend(i.Remainder[0:i.DataLen])
        elif isinstance(i,RawX86Jumpout):
            mcArr.extend(i.Instruction[0:i.DataLen])

        # Is it a branch instruction?
        elif isinstance(i, ConditionalBranch):

            # Get the name of the branch
            jccName = INSN_NAME_DICT[i.Opcode]

            # Is this an unconditional jump?
            if jccName == "JMP":

                # Emit 0xE9 (x86 JMP disp32)
                mcArr.append(0xE9)

                # Opcode is 1 byte
                dispPos = 1

            # Otherwise, it's a conditional jump
            else:
                # Conditional jumps begin with 0x0F
                mcArr.append(0x0F)
                
                # Second byte is specific to the condition code
                mcArr.append(JCC_TO_OPCODE_DICT[jccName])

                # Opcode is 2 bytes
                dispPos = 2

            # Emit the displacement DWORD (0 for now)
            mcArr.extend([0x00, 0x00, 0x00, 0x00])

            # Emit a fixup: the JMP displacement targets
            # the VM location specified by i.VMTarget
            locFixups.append((i.Pos,dispPos,i.VMTarget))

        # Is it X86CALLOUT?
        elif isinstance(i,RawX86Callout):
            
            # We aren't handling this just yet.
            # Emit E8 00 00 00 00 (CALL $+5)
            # Revisit later
            mcArr.append(0xE8)
            mcArr.extend([0x00, 0x00, 0x00, 0x00])

Now we discuss the cases above:

  • The instruction is Group #3 "Raw X86", which already contains raw x86 machine code in an array inside of the VM instruction object. In this case, we simply append the raw x86 machine code to the array.
  • The instruction is Group #3 "Call Indirect". As this instruction also contains raw x86 machine code, the initial idea and approach was to simply append it to the array identically to the previous case. (I later discovered that this case required more care, though it ended up not being very difficult.)
  • The instruction is a Group #1 conditional or unconditional jump. We discuss these in a subsequent subsection.
  • The instruction is "Call Direct" (symbolized as X86CALLOUT in the FinSpy VM disassembly listing). We discuss these later in this subsection.

2.2 Bookkeeping Cross-References

While translating the instructions as described above, we update two dictionaries to keep track of the position of each VM instruction within the x86 machine code array. Recall from the introduction in Part #3, Phase #1 that each VM instruction has two uniquely identifying characteristics: 1) its offset within the VM bytecode array, a multiple of 0x18 (the length of a VM instruction), and 2) a "key" DWORD used to locate instructions. The two dictionaries, called locsDict and keysDict respectively, map each instruction's position, and each instruction's key, to the offset within the x86 machine code array where the devirtualized instruction resides. Reproducing the pertinent snippets from the simplified code above:

# Given: insns, a list of FinSpy VM instructions
# Generate and return an array of x86 machine code bytes for the VM program
def RebuildX86(insns):
    # Array of x86 machine code, built instruction-by-instruction
    mcArr  = []
    
    # Bookkeeping: which VM location/key corresponds to which
    # position within the x86 machine code array mcArr above
    locsDict = dict()
    keysDict = dict()
    
    # Iterate through the instructions
    for i in insns:
        
        # currLen is the current position in mcArr
        currLen = len(mcArr)
        
        # Bookkeeping: memorize the x86 position for the 
        # VM instruction's VM position and VM key 
        locsDict[i.Pos] = currLen
        keysDict[i.Key] = currLen
        
        # ... code to devirtualize was shown above ... 

For example, the first VM instruction (the one at position 0x0 within the VM instruction array) is emitted at position 0 within the x86 machine code blob. Thus, we update the dictionary locsDict with the binding locsDict[0x0] = 0x0 (i.e., VM bytecode position 0x0 -> x86 machine code position 0x0). The first instruction has key 0x5A145D, so we update the dictionary keysDict with the binding: keysDict[0x5A145D] = 0x0.

The second VM instruction shall be devirtualized after the first instruction. The devirtualized first instruction was three bytes in length, thus the second VM instruction begins at position 3 within the x86 machine code array. Since the second VM bytecode instruction corresponds to position 0x78 within the VM bytecode array (after the simplifications from the previous Part #3, Phase #1), we update our dictionary with the information: locsDict[0x78] = 3 (i.e., VM bytecode position 0x78 -> x86 machine code instruction position 0x3). The second instruction has key 0x5A1461, so we update the dictionary keysDict with the binding: keysDict[0x5A1461] = 0x3. 

This process continues sequentially for every instruction that we translate. We start a counter at 0x0, add the length of the devirtualized x86 machine code after each step, and at each iteration we associate the current value of the counter with the instruction's key and position before generating x86 machine code.

2.3 De-Virtualizing Branch Instructions

We have deferred discussing conditional branches; now we shall take the subject up again. 

x86 branch instructions are encoded based on the distance between the address of the branch instruction and the address of the target. The addresses themselves of the source and destination locations aren't important, only the difference between them. The opcode of each of the 16 x86 conditional branch types is 0F 8x for some value of x; the opcode for an unconditional branch is E9. To encode a jump targeting the address 0x1234 bytes after the JMP instruction, this would be encoded as E9 34 12 00 00. If we needed to encode an x86 "JZ" instruction, whose destination was 0x1234 bytes after the JZ instruction, the encoding would be 0F 84 34 12 00 00.

Since we are devirtualizing VM instructions one-by-one in forward order, if the branch target is in the reverse direction, that means we've already devirtualized the destination, and hence we could immediately write the proper displacement. However, if the branch target is in the forwards direction, that means the destination lies at an address of a VM instruction that we haven't translated yet, and so we don't know the address of the destination, and so we can't immediately generate the x86 branch instruction. This conundrum -- common in the world of linkers -- necessitates a two-phase approach.

  1. Phase #1: During devirtualization, the first thing to do is to emit the opcode for the jump (recalling the previous examples, e.g., E9 for an unconditional JMP, or 0F 84 for a conditional JZ). This is easy; we just look up the proper opcode for a given jump type within a dictionary that maps VM branch instruction types to x86 opcodes. After the x86 opcode for the branch type, we write a displacement DWORD of 0x0. Crucially, we also generate a "fixup": we add an entry to a list that contains both the position of the displacement DWORD within the x86 machine code array, as well as the VM bytecode instruction EIP to which the jump must eventually point. These fixups are processed by phase two. (Note that the code for phase #1 was shown in the previous section.)
  2. Phase #2: After devirtualizing the entire FinSpy VM bytecode program, the "locsDict" dictionary described in the previous section on bookkeeping now has information about where each VM instruction lies within the devirtualized x86 machine code array. We also have a list of fixups, telling us which locations in the x86 machine code program correspond to the dummy 0x0 DWORDs within the branch instructions that we generated in the previous phase, which now need to be fixed up to point to the correct locations. Each such fixup also tells us the position of the VM bytecode instruction (within the VM bytecode array) to which the branch should point. Thus, we simply look up the destination's devirtualized x86 machine code position within locsDict, and compute the difference between the position after the jump displacement DWORD and the position of the destination. We replace the dummy 0x0 DWORD with the correct value. Voila, the branches now have the correct destinations.

Here is the code for phase #2, which executes after the main loop in "RebuildX86" has emitted the devirtualized x86 machine code for all VM instructions:

# Fixups contain:
# * srcBegin: beginning of devirtualized branch instruction
# * srcFixup: distance into devirtualized branch instruction
#             where displacement DWORD is located
# * dst:      the position within the VM program where the
#             branch destination is located
for srcBegin, srcFixup, dst in locFixups:
    # Find the machine code address for the source
    mcSrc = locsDict[srcBegin]
    # Find the machine code address for te destination
    mcDst = locsDict[dst]
    # Set the displacement DWORD within x86 branch instruction
    StoreDword(mcArr, mcSrc+srcFixup, mcDst-(mcSrc+srcFixup+4))

(Pedantic optional note: x86 also offers short forms of the conditional and unconditional branch instructions: if the displacement of the destination fits within a single signed byte, there are shorter instructions that can be used to encode the branch. I.e., EB 50 is the encoding for unconditionally jumping to 50 bytes after the source instruction, and 75 F0 performs a JNZ to 0xFFFFFFF0 bytes after the source instruction. Because using the short forms requires a more sophisticated analysis, I chose to ignore the short forms of the branch instructions (and use only the long forms) when performing devirtualization. The only side effect of this is that some branch instructions in the devirtualized program are longer than necessary -- but in terms of their semantic effects, the long and short branches function identically. If you wanted to be less lazy about this, and emit small jumps when applicable, you should read this paper or the source code to an x86 assembler.)

2.4 Devirtualizing X86CALLOUT Instructions, Take One

The last variety of VM instruction that we need to handle is the X86CALLOUT instruction. These instructions specify an RVA within the .text section at which the targeted x86 function begins. x86 CALL instructions are encoded identically to x86 branch instructions -- following the x86 CALL opcode E8, there is a DWORD specifying the distance from the end of the x86 CALL instruction to the target address. Thus, like we just discussed for devirtualizing branch instructions, we need to know the source and destination addresses for the CALL to generate the proper displacement for the x86 CALL instruction. 

The targets of the virtualized branch instructions are specified as locations within the VM program. I.e., none of the jumps exit the VM. Thus, our task in fixing the branch instructions was simply to locate the distance between the branch instruction in the devirtualization and its target. Since x86 branch instructions are relatively-addressed, we do not need to take into account where within the original binary we will eventually reinsert the devirtualized code -- just the distance between the source and target address is enough information.

On the other hand, the targets of all X86CALLOUT instructions are outside of the VM. Like with jumps, we'll need to know the distance between the source and target addresses. Unlike with jumps, for the devirtualized CALL instructions, we do need to know where within the original binary our devirtualized code shall be located in order to compute the CALL displacement DWORD correctly.

Since I hadn't decided where I was going to store the devirtualized code, and yet I wanted to see if my devirtualization process was otherwise working, I decided to postpone resolving this issue. I decided for the time being to just generate dummy x86 instructions to devirtualize X86CALLOUT instructions. I.e., for each "Call Direct" VM instruction, at this stage, I chose to emit E8 00 00 00 00 (x86 CALL $+5) for its machine code. Clearly this is an incorrect translation -- to reiterate, this approach is just a placeholder for now -- and the devirtualized program will not work at this stage (and we won't see proper call destinations in the devirtualized program), but doing this allowed me to proceed without having to decide immediately where to put the devirtualized code. 

(Note that when it came time to fix this issue, I actually discovered a second and much more severe set of issues with devirtualizing X86CALLOUT instructions, which ended up consuming roughly half of my total time spent in the devirtualization phase. We will return to those issues when they arise naturally.)

3. Moment of Truth, and Stock-Taking

At last, we have our first devirtualized version of the FinSpy VM bytecode program for this sample. If you would like to see the results for yourself, you can load into IDA the binary for the first devirtualization. Now for the real test: did it work? How close to being done are we?

I took the output .bin file and loaded it into IDA. It looked pretty good! Most of it looks like something that was generated by a compiler. After the thrill of initial success wore off, I began looking for mistakes, things that hadn't been properly translated, or opportunities to improve the output. After this investigation, I'll go back to the drawing board and see what I can do about fixing them. Then I'll do the same thing again: look at the second iteration of the output, find more issues, fix them, and repeat. Hopefully, this process will eventually terminate. (It did.)

3.1 Problem #1: Call Targets are Missing

This problem was anticipated. As discussed in the last section, since I wasn't sure just yet how to handle the X86CALLOUT targets, I deliberately emitted broken x86 CALL instructions (namely E8 00 00 00 00, CALL $+5), with the plan to fix them later. Not surprisingly, those instructions were broken in the devirtualized output:

seg000:000005D6 BE 08 02 00 00        mov     esi, 208h
seg000:000005DB 56                    push    esi
seg000:000005DC 8D 85 C0 FB FF FF     lea     eax, [ebp-440h]
seg000:000005E2 57                    push    edi
seg000:000005E3 50                    push    eax
seg000:000005E4 E8 00 00 00 00        call    $+5 ; <- call target missing
seg000:000005E9 56                    push    esi
seg000:000005EA 8D 85 C8 FD FF FF     lea     eax, [ebp-238h]
seg000:000005F0 57                    push    edi
seg000:000005F1 50                    push    eax
seg000:000005F2 E8 00 00 00 00        call    $+5 ; <- call target missing
seg000:000005F7 56                    push    esi
seg000:000005F8 8D 85 A8 F5 FF FF     lea     eax, [ebp-0A58h]
seg000:000005FE 57                    push    edi
seg000:000005FF 50                    push    eax
seg000:00000600 E8 00 00 00 00        call    $+5 ; <- call target missing
seg000:00000605 83 C4 24              add     esp, 24h

Therefore I don't know where any of the calls are going, and so there are no function call cross-references. Obviously we will need to stop kicking the can down the road at some point and properly attend to this issue.

3.2 Observation #2: What are These Indirect Jump Instructions?

Another thing I noticed was an odd juxtaposition of indirect jump instructions where the surrounding context indicated that an indirect call would have been more sensible. For example:

seg000:00000B51     push    dword ptr [ebp-0Ch]
seg000:00000B54     mov     eax, ds:41FF2Ch
seg000:00000B59     jmp     dword ptr [eax+14h]
seg000:00000B5C     mov     eax, ds:41FF38h
seg000:00000B61     push    esi
seg000:00000B62     jmp     dword ptr [eax+90h]
seg000:00000B68     mov     eax, ds:41FF38h
seg000:00000B6D     jmp     dword ptr [eax+74h]

We see arguments being pushed on the stack, as though in preparation for a call. Then, instead of a call, we see a jump. Then, the assembly language indicates that another call should be taking place, but instead there's another indirect jump. There are no intervening cross-references jumping to the locations after the indirect jumps. What's up with that?

3.3 Problem #3: None of the Functions Have Prologues

Although a lot of the functions looked exactly like x86 machine code emitted by Microsoft Visual Studio to me, something was off. IDA tipped me off to the problem, since every function had a red message indicating a problem with the function's stack frame. Here is a screenshot of IDA, showing the colored message (and with the stack pointer shown for illustration):

brokenStack.png

Most of the code looks good, but the "leave" instruction is supposed to pop the EBP register off the stack -- and yet the prologue does not push the EBP register onto the stack. Also, the first instruction makes reference to "[EBP+8]", which assumes that EBP has previously been established as the frame pointer for this function -- and yet, being the first instruction in the function, clearly the devirtualized code has not yet established EBP as the frame pointer. Which memory location is actually being accessed by this instruction?

In other functions, we see the epilogues popping registers off the stack -- but inspecting the beginnings of those functions, we see that those instructions were not previously pushed onto the stack. Here's an example from the beginning of a function:

seg000:000004FB     mov     ebx, [ebp+8]     ; Overwrite EBX
seg000:000004FE     mov     edi, [ebx+3Ch]   ; Overwrite EDI
seg000:00000501     add     edi, ebx
seg000:00000503     mov     eax, [edi+0A0h]
seg000:00000509     test    eax, eax         ; Early return check
seg000:0000050B     jz      return_ebx       ; JZ taken => fail, return

; ... more function code ...

seg000:000005A3 return_ebx:
seg000:000005A3     pop     edi              ; Restore EDI (NOT PREVIOUSLY SAVED)
seg000:000005A4     mov     eax, ebx
seg000:000005A6     pop     ebx              ; Restore EBX (NOT PREVIOUSLY SAVED)
seg000:000005A7     leave                    ; Restore EBP (NOT PREVIOUSLY SAVED)
seg000:000005A8     retn    8                ; Return

We're going to need to know why these functions seemingly are missing instructions at their beginnings.

I can see why IDA is complaining about these functions -- despite being mostly coherent x86 implementations of C functions, they are clearly slightly broken. But how are they broken, and how can I fix them?

At this point I remembered something about the original binary. Back in part one, we analyzed a few VM entrypoints, and noticed that they began with normal-looking function prologues, before a segue into gibberish instructions, before finally pushing a VM key on the stack and transferring control to the VM entrypoint. To wit, here is the x86 code corresponding to the virtualized function from the screenshot above:

.text:00401340     push    ebp                     ; Ordinary prologue
.text:00401341     mov     ebp, esp                ; Ordinary prologue
.text:00401343     push    esi                     ; Save obfuscation register #1
.text:00401344     push    edx                     ; Save obfuscation register #2
.text:00401345     mov     edx, offset word_403DFE ; Junk obfuscation
.text:0040134A     xor     esi, esp                ; Junk obfuscation
.text:0040134C     shl     esi, cl                 ; Junk obfuscation
.text:0040134E     shr     esi, 1                  ; Junk obfuscation
.text:00401350     shl     esi, cl                 ; Junk obfuscation
.text:00401352     pop     edx                     ; Restore obfuscation register #2
.text:00401353     pop     esi                     ; Restore obfuscation register #1
.text:00401354     push    5A145Dh                 ; Push VM instruction key
.text:00401359     push    edx                     ; Obfuscated JMP
.text:0040135A     xor     edx, edx                ; Obfuscated JMP
.text:0040135C     pop     edx                     ; Obfuscated JMP
.text:0040135D     jz      GLOBAL__Dispatcher      ; Enter VM

That's where the missing function prologues went -- they are still at the locations where at which original functions resided within the binary. The prologues have not been virtualized. Upon calling an x86 function that has been virtualized, the function prologue will execute in x86 as usual, before the virtualized body of the function is executed within the VM. So in order to properly devirtualize the functions within the VM bytecode, we will need to extract their prologues from the x86, and during devirtualization, prepend those prologue bytes before the devirtualization of the function bodies. 

4. Fixing the Indirect Jumps

Now that we've identified a few issues with the devirtualized code, our next task is to fix them. We'll start with the lowest-hanging of the fruit, the weird indirect jumps, reproduced here for coherence:

seg000:00000B51     push    dword ptr [ebp-0Ch]
seg000:00000B54     mov     eax, ds:41FF2Ch
seg000:00000B59     jmp     dword ptr [eax+14h]
seg000:00000B5C     mov     eax, ds:41FF38h
seg000:00000B61     push    esi
seg000:00000B62     jmp     dword ptr [eax+90h]
seg000:00000B68     mov     eax, ds:41FF38h
seg000:00000B6D     jmp     dword ptr [eax+74h]

The x86 JMP instructions were copied verbatim from machine code stored within X86JUMPOUT instructions. So, in a sense, the JMP instructions are "correct". Nevertheless, this disassembly listing looks wrong. The indirect jump does not push a return address, so the code at the destination doesn't know where to resume executing. Consequently, the instruction following one of the indirect jumps will never execute unless its address is referenced somewhere else in the devirtualized code -- but that didn't seem to be the case, and it would have been weird if it was the case, since none of the situations in which a compiler would have emitted an address contained within the body of a function (a switch case, or an exception handler) seemed to apply. Another possibility would have been tail calls to function pointers, but the context of the indirect jumps did not indicate that a tail call was about to take place.

It struck me that these indirect jumps probably ought to be indirect calls instead. To investigate, I looked again at the disassembly of the VM instruction handler for the "Indirect Call" instructions. The "Indirect Call" FinSpy VM instruction is one of the ones that generates code dynamically while executing. Reproduced from part two, here's the code that the FinSpy VM generates dynamically when interpreting an "Indirect Call" instruction:

popf                          ; Restore flags from VMContext
popa                          ; Restore registers from VMContext
push offset @RESUME           ; PUSH RETURN ADDRESS (@RESUME)
[X86 machine code for indirect jump, copied from VM instruction]
@RESUME:                      ; <- RETURN LOCATION
push offset NextVMInstruction ; Resume at next VM insn
pusha                         ; Save registers
pushf                         ; Save flags
push offset VMContext
pop ebx                       ; EBX := VMContext *
push offset fpVMReEntryReturn
ret                           ; Re-enter VM

So indeed, before executing the indirect jump instruction from the x86 machine code stored within the instruction, the FinSpy VM "Indirect Call" handler pushes a return address on the stack. The return address points to the dynamically-generated code at the @RESUME label in the snippet above, which then continues execution at the next VM instruction following the "Indirect Call" instruction. That's why the devirtualized code isn't pushing a return address -- the VM takes care of that.

I expect that the FinSpy VM authors have code to translate x86 indirect call instructions into x86 indirect jump instructions. Thus I will need to do the reverse process: I will need to take the raw machine code contained in the "Indirect Call" VM instructions, and convert the x86 indirect jump instructions into call instructions instead. I wrote the following function, and added a call to it in the constructor for the Python object representing an "Indirect Call" VM instruction:

# This function disassembles the raw machine code for indirect jump instructions,
# changes the instructions therein to indirect call instructions, re-assembles
# them, and returns the new machine code with its textual disassembly.
#
# Input: bytes, an array of machine code for an indirect jump.
# Output: a tuple (string: disassembly, bytes: machine code for indirect call)

def ChangeJumpToCall(bytes):

    # Decode the x86 machine code
    i2container = X86Decoder(StreamObj(bytes)).Decode(0)

    # Fetch the instruction from the decoded bundle
    insn = i2container.instr

    # Ensure it's an indirect jump!
    assert(insn.mnem == XM.Jmp)

    # Change the mnemonic to call
    insn.mnem = XM.Call

    # Return new textual disassembly and machine code
    return (str(insn),EncodeInstruction(insn))

In reality, using my disassembler library was overkill here. There are only a few ways to encode indirect calls and indirect jumps in x86 machine code; simple pattern-replacement could have identified and re-written them very easily. But despite being overkill, there are no technical drawbacks with the solution based on rewriting and reassembling the instructions.

The devirtualized binary after the above changes can be found here.

5. Conclusion

We began this Phase #2 with a deobfuscated FinSpy VM bytecode disassembly listing. From there, we formulated a strategy to devirtualize the program instruction-by-instruction. This was mostly straightforward, except we deliberately did not devirtualize the X86CALLOUT instructions from Group #3. After devirtualization, we discovered several remaining issues, all relating to functions and function calls. This phase ended by examining and fixing one of those issues.

In the next Part #3, Phase #3, we will examine the source of the function-related issues in our current devirtualization. In so doing, we will learn that we need to obtain some specific information about the X86CALLOUT VM instructions and virtualized functions that we shall need to obtain and incorporate into our devirtualization process. Part #3, Phase #3 will then write scripts to collect this information. The final Part #3, Phase #4 will then incorporate this information into the devirtualization process, and then discover and correct a few remaining issues before producing the final devirtualized listing for the FinSpy VM bytecode in our running example.

FinSpy VM Unpacking Tutorial Part 3: Devirtualization. Phase #1: Deobfuscating FinSpy VM Bytecode Programs

[Note: if you've been linked here without context, the introduction to Part #3 describing its four phases can be found here.]

1. Introduction

In part one of this series, we analyzed the obfuscation on the x86 implementation of the FinSpy VM, and wrote a tool to deobfuscate it to allow easier analysis. In the second part of this series, we analyzed the VM instruction set, wrote a disassembler that works for the running example, and obtained the VM bytecode listing. Now we are left with devirtualization: we want to regenerate a facsimile of the original x86 program prior to virtualization.

This task winds up being fairly lengthy, so we have divided the approach into four phases, which corresponds to the work I did in devirtualizing FinSpy in the same order in which I did it. (That being said, don't mistake "lengthy" for "difficult".) We begin Phase #1 by inspecting the FinSpy VM bytecode program, discovering obfuscation involving the "Group #2" instructions, and removing it via pattern-substitution.

2. Devirtualizing FinSpy: Initial Observations and Strategy

At this point in the process, I had my first listing of the VM bytecode program in disassembled form. I began by inspecting the VM bytecode program and identifying ways to simplify the bytecode. This ultimately resulted in the wholesale elimination of the Group #2 instructions.

You may wish to inspect the initial VM bytecode disassembly, which we shall progressively refine throughout this Phase #1. Along the way, after discovering and applying simplifications, we will gradually obtain new VM bytecode disassembly listings, which will be linked throughout.

2.1 Recap of FinSpy VM Instruction Set and Bytecode Programs

To summarize part two, the FinSpy VM uses a fixed-length instruction encoding, with each VM instruction represented by a structure that is 0x18 bytes in length. 

Each instruction within a FinSpy VM program has two uniquely identifying characteristics associated with it. For one, we can refer to the raw position of the VM instruction within the array of VM bytecode instructions. So for example, the first instruction is located at position 0x0. Since each instruction is 0x18 bytes in length, the second instruction is located at position 0x18, and generally instruction #N is located at position 0x18*N within the bytecode array.

The second identifying characteristic for an instruction is its "key", a 32-bit value (the first DWORD in an encoded FinSpy VM instruction) that can be used to locate a particular VM instruction. Specifically, before entering the VM, the x86 code that executes before transferring control to the FinSpy VM interpreter first pushes a key DWORD onto the stack. Upon entering the VM, the FinSpy VM initalization code loads the key DWORD pushed by the x86 portion, searches through the VM bytecode array to locate the VM instruction with that key, and then begins interpreting VM instructions starting from that location. (It turns out that FinSpy VM instruction keys cause some complications in devirtualization, as we shall see later.)

Most FinSpy VM instructions are assumed to execute sequentially. That is, after one VM instruction completes, the x86 code for the instruction handler adds 0x18 to the current VM EIP, to advance it to the next VM instruction. VM control flow instructions may behave differently, e.g., the conditional branch instructions are relatively-addressed like their x86 counterparts (if the branch is taken, the VM instruction adds a displacement, a multiple of 0x18, to VM EIP; if the branch is not taken, execution continues at the VM instruction 0x18 bytes subsequent to the current instruction). The FinSpy VM also has an instruction for direct calls, and another one for indirect calls. These call instructions behave like you'd expect; they push a return address onto the stack to re-enter the VM after the called function returns.

The FinSpy VM's instruction set consists of three instruction groups:

  • Group #1: Conditional and unconditional jumps, (namely, JMP and all 16 of x86's conditional branches such as JZ, JNS, and JP).
  • Group #2: VM instructions that access the FinSpy VM's single dedicated register.
  • Group #3: VM instructions that contain raw x86 instructions inside of them.

2.2 Preliminary Thoughts on Devirtualization

After analyzing the VM's instruction set and perusing the VM bytecode program, it seemed like the group #3 VM instructions -- those with embedded x86 machine code blobs -- would be easy to convert back into x86. There are three VM instructions in this group: "Raw X86", "Call Direct", and "Call Indirect". (In practice, the latter two VM instructions wound up presenting more complications than anticipated, with direct calls being the most difficult aspect of the VM to devirtualize.)

Group #1, the conditional and unconditional branch instructions, seemed similarly easy to translate back to x86, since their implementations are virtually identical to how x86 conditional branches operate internally. Since conditional branches use relative displacements to determine the address of the "taken" branch, the only challenge is to determine the relative locations of each devirtualized instruction. Thus, once we know exactly how far the branch instruction is from its destination, we can simply compute the displacement. (Indeed, in practice, this was easy.)

Group #2, the set of VM instructions that access the FinSpy VM's single dedicated register, was the wild-card. Although from analyzing the FinSpy VM harness I knew the raw functionality of these instructions, I did not know before analyzing the VM program how these instructions would be used, and nor how to devirtualize them. For ease of reference, those instructions are summarized below from their more detailed expositions in part two:

mov scratch, 0                      [Operand: none]
mov scratch, imm32                  [Operand: imm32]
shl scratch, imm32                  [Operand: imm32]
add scratch, imm32                  [Operand: imm32]
mov scratch, savedReg32             [Operand: index of savedReg32]
add scratch, savedReg32             [Operand: index of savedReg32]
mov savedReg32, scratch             [Operand: index of savedReg32]
mov dword ptr [scratch], savedReg32 [Operand: index of savedReg32]
mov scratch, dword ptr [scratch]    [Operand: none]
mov dword ptr [scratch], imm32      [Operand: imm32]
mov dword ptr [imm32], scratch      [Operand: imm32]
push scratch                        [Operand: none]

Given that the other two groups seem straightforward, and the heretofore-unknown nature of Group #2, this seems like a good first task to devirtualize our FinSpy VM program: analyze the usage patterns of group #2 instructions, and formulate a strategy for converting them back to x86 machine code. (This turned out to be very easy and intuitive in practice, with no real complications to speak of.)

3. Step #1: Tweak the Output to Print the x86 Disassembly

Upon perusing the output of my FinSpy VM disassembler, my first observation was that my task would benefit from knowing the textual disassembly for the "Raw x86" instructions, which were being rendered as raw machine code bytes. For example, the first few instructions in the VM bytecode disassembly were:

0x000000: MOV SCRATCH, 0
0x000018: ADD SCRATCH, EBP
0x000030: ADD SCRATCH, 0x000008
0x000048: MOV SCRATCH, DWORD PTR [SCRATCH]
0x000060: MOV EAX, SCRATCH
0x000078: X86 [199, 0, 215, 1, 0, 0] ; <- x86 machine code
0x000090: X86 [184, 0, 240, 65, 0]   ; <- would prefer x86 assembly
0x0000a8: X86 [201]
0x0000c0: X86 [194, 4, 0]

My proximate goal was to figure out how the Group #2 instructions (those involving the SCRATCH register, the first five in the listing above) were used within the VM program. For context, it would be nice to see what the X86 instructions on the four subsequent lines were doing. I.e., it would be convenient to have a textual representation for the x86 machine code, instead of the above display as lists of bytes. 

For this task, I was fortunate to have already written an x86 disassembler and assembler library in Python. (I have previously released this code to the public as part of the course sample for my SMT-Based Program Analysis training class.) For the two group #3 VM instructions with embedded x86 machine code -- "Raw X86" and "Call Indirect" -- I modified my FinSpy VM disassembler to invoke the x86 disassembler functionality when printing them. This was trivial to accomplish in the __str__() method for these Python classes, for example:

        d = X86Decoder(self.Remainder[0:self.DataLen])
        i2container = d.Decode(0)

After doing this, the VM bytecode disassembly listing was easier to follow. An example is shown below; the full disassembly listing can be found here.

0x000000: MOV SCRATCH, 0
0x000018: ADD SCRATCH, EBP
0x000030: ADD SCRATCH, 0x000008
0x000048: MOV SCRATCH, DWORD PTR [SCRATCH]
0x000060: MOV EAX, SCRATCH
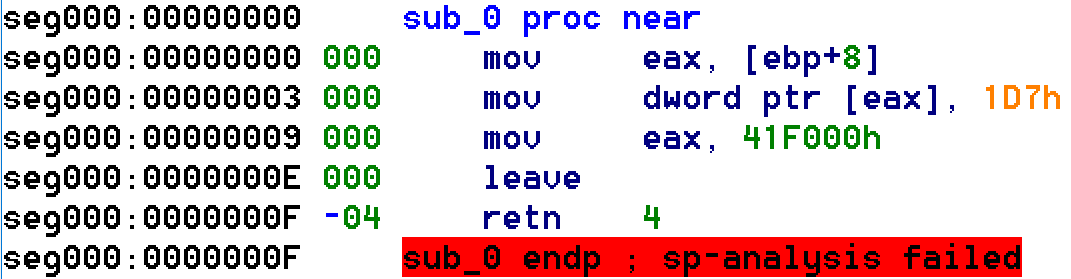
0x000078: X86 mov dword ptr [eax], 1D7h ; <- new: x86 assembly, not machine code
0x000090: X86 mov eax, 41F000h
0x0000a8: X86 leave
0x0000c0: X86 ret 4h

After some quick perusal, the x86 assembly language mostly looks like ordinary C code compiled with MSVC, though some functions use instructions like PUSHA and POPA that are not ordinarily generated by normal compilers, and hence were probably written in assembly language prior to virtualization.

4. Step #2: Pattern-Based Simplification for Scratch Register Access

Having a clearer FinSpy VM bytecode disassembly listing, I returned to trying to figure out what the Group #2 "dedicated register" instructions were accomplishing. It's easy enough to locate these instructions; all of them use the scratch register, which is denoted "SCRATCH" in the VM bytecode disassembly, so you can simply search for "SCRATCH" to see where these instructions are used. (Or just look at the disassembly listing -- group #2 instructions comprise a significant fraction of the VM instructions for our sample.)

Here I went a bit too fast and would have benefited from being a bit more deliberate. Inspecting the beginning of the VM bytecode program, I noticed a few different patterns involving loading x86 register values into the scratch register. For example, repeating the first two lines from the example in the last section, we see:

0x000000: MOV SCRATCH, 0
0x000018: ADD SCRATCH, EBP

This code first sets the scratch register to zero, and then adds the value of EBP. Effectively, this two-instruction sequence sets the scratch register to EBP. However, elsewhere there were different patterns of VM instructions used to accomplish the same goal. Here was the second pattern:

0x03c270: MOV SCRATCH, 0
0x03c288: MOV SCRATCH, EDX

And still elsewhere in the FinSpy VM bytecode disassembly, we see more natural one-instruction sequences to load register values into the stack register, for example:

0x001b48: MOV SCRATCH, ECX

Faced with these observations, I mistakenly identified this as a form of obfuscation: it seemed as though there were several ways to load the value of an x86 register into the scratch register, and that FinSpy was choosing between them arbitrarily in order to introduce some randomness into the VM bytecode program. Such randomness could make pattern-recognition more laborious. It might end up that I would need to write multiple patterns to match these sequences, thereby multiplying the number of patterns I needed to write involving x86 register loads by the number of patterns that the FinSpy VM employed for loading an x86 register into the SCRATCH register.

I figured that I could save work for myself down the road if I coalesced the two-instruction sequences down into a canonical representation of loading a register into the stack, namely, one instruction sequences as in the third example. (I later realized that this isn't really a form of obfuscation -- the FinSpy VM developers were just being lazy.)

To be specific, I wanted to write a search-and-replace rule that would take VM instruction sequences of the form:

MOV SCRATCH, 0      | MOV SCRATCH, 0      
ADD SCRATCH, REG32  | MOV SCRATCH, REG32

And replace them with one-instruction sequences of the form:

MOV SCRATCH, REG32

It was easy enough to accomplish the pattern recognition and replacement using Python's type introspection functionality. Since my Python FinSpy VM disassembler from part two used Python class types for these individual VM bytecode instruction types, I could simply invoke the "isinstance" function to find instances of these patterns in the VM bytecode disassembly listing. The code for this can be found in the function "FirstSimplify" (search the code for that name to find the exact point of definition).

For instance, here is the code to identify the "MOV SCRATCH, 0" VM instruction. It encompasses two different possibilities: the dedicated VM instruction that moves 0 into SCRATCH, and the VM instruction that moves an arbitrary DWORD value into SCRATCH, when the DWORD is zero.

def IsMovScratch0(insn):
    if isinstance(insn,MovScratch0):
        return True
    if isinstance(insn,MovScratchImm32):
        return insn.Imm32 == 0
    return False

The complete code for recognition and replacement is shown in the following sequence. Please take the time to examine it, as all of the pattern-matching and replacement in the rest of this section have similar implementations, and won't be discussed in much detail for the sake of brevity.

# If the first VM instruction is "MOV SCRATCH, 0"...
if IsMovScratch0(i1):

    # Check to see if the second instruction is "MOV SCRATCH, REG32". If 
    # this function returns None, it wasn't. If it returns something other
    # than None, then it returns the register number.
    mr = IsMovScratchReg(i2)
                
    # Otherwise, check to see if the instruction was "ADD SCRACH, REG32",
    # and get the register number if it was (or None if it wasn't).
    if mr is None:
        mr = IsAddScratchReg(i2)
                
    # Did one of the two patterns match?
    if mr is not None:
                    
        # Yes: make a new VM instruction, namely "MOV SCRATCH, REG32" to 
        # replace the two instruction sequence we just matched. Use the same
        # file offset position from the first instruction in the sequence.
        newInsn = MovScratchDisp8([0]*INSN_DESC_SIZE, i1.Pos)
                    
        # Save the register number into the new instruction.
        newInsn.Disp8 = mr
                    
        # Use the same VM instruction key as for the first instruction.
        newInsn.Key = i1.Key
                    
        # Add the new VM instruction to the output list.
        newInsnArr.append(newInsn)

If one of the two patterns match, the code above generates a new VM instruction to replace the existing two. Since each VM instruction is uniquely associated with a position and key, we decided to copy those attributes from the first VM instruction within the matched pattern, and to delete the second VM instruction outright. (I worried that I might encounter situations where other VM instructions would reference the second and now-deleted VM instruction by its key or EIP, and in fact I had to account for this in Part #3, Phase #4.)

The new VM bytecode disassembly listing can be found here.
    
(Note that I originally wrote these pattern replacements in OCaml, since ML-family languages are intentionally designed with robust facilities for these sorts of tasks. My first implementation had the Python program print out an OCaml representation of the FinSpy VM program, which an OCaml program then simplified via pattern-substitutions. However, given that only a few such pattern-replacements were necessary to deobfuscate FinSpy VM bytecode programs, I decided that the cognitive and programmatic overhead of serializing between the OCaml and Python programs was unnecessarily complicated, and so I re-wrote the pattern replacement code in pure Python, despite the tedium.)

4.1 The "MOV SCRATCH, REG32" / "PUSH SCRATCH" Pattern

Next, I continued to inspect the VM bytecode disassembly listing and look for further patterns involving the SCRATCH register. I found my next candidate shortly after the previous one. In particular:

0x000120: MOV SCRATCH, ECX
0x000138: PUSH SCRATCH

This VM instruction sequence obviously replaces the x86 instruction "push ecx". As with the previous step, I decided to codify this into a pattern simplification. Any time we see the VM instruction sequence:

MOV SCRATCH, REG32
PUSH SCRATCH

We want to replace that with a single VM instruction representing "push reg32". Mechanically, this works nearly identically to the previous step; we use Python's isinstance() function to find occurrences of this VM instruction pattern. The complete code can be found in the "SecondSimplify" function in the Python source code (search for the function name). For ease of reference, here is how we identify "MOV SCRATCH, REG32" instructions:

def IsMovScratchReg(insn):
    if isinstance(insn,MovScratchDisp32):
        return insn.Disp32
    if isinstance(insn,MovScratchDisp8):
        return insn.Disp8
    return None

To replace these two-instruction sequences, we generate a FinSpy VM "Raw x86" instruction which contains the x86 machine code for the x86 PUSH operation. I use my x86 library to create the Python object for the replacement x86 instruction "push reg32": in this example, the Python object for "push ecx" can be constructed as X86.Instruction([], XM.Push, X86.Gd(mr,True)).

After generating the replacement x86 instruction object, I wrote a function to generate a FinSpy VM instruction containing the raw machine code. The function "MakeRawX86" from the simplification source code (search for the function name) is reproduced here for ease of presentation:

def MakeRawX86(Pos, Key, x86Insn):
    # Create a FinSpy VM "Raw X86" instruction with dummy
    # content at the correct position (specified by Pos)
    newInsn = RawX86StraightLine([0]*INSN_DESC_SIZE, Pos)

    # Set the key to be the key from the first of the two
    # instructions of the two-instruction matched sequence
    newInsn.Key = Key

    # Encode the x86 instruction into machine code, store
    # the bytes in the FinSpy VM instruction
    newInsn.Remainder = EncodeInstruction(x86Insn)
    
    # Cache the length of the x86 instruction's machine code
    newInsn.DataLen = len(newInsn.Remainder)

    # Cache the textual disassembly for that instruction
    newInsn.X86 = str(x86Insn)
    
    # Return the FinSpy VM instruction just constructed
    return newInsn

The FinSpy VM "Raw X86" instruction object returned by the function above is used as the replacement for the two-VM instruction sequence "MOV SCRATCH, REG32 / PUSH SCRATCH". As the code shows, its two uniquely-identifying characteristics (VM instruction position and VM instruction key) are duplicated from the first of the two VM instructions in the pattern.

After applying this substitution, the new VM bytecode disassembly listing can be found here.

4.2 The "MOV SCRATCH, REG32" / "MOV REG32, SCRATCH" Pattern

Shortly thereafter was another, similar VM instruction pattern:

0x000228: MOV SCRATCH, ESP
0x000240: MOV ESI, SCRATCH

Clearly, this sequence virtualizes the x86 instruction "mov esi, esp". More generally, when we see two adjacent VM instructions of the form:

MOV SCRATCH, REG32_1
MOV REG32_2, SCRATCH

We can replace this with an x86 instruction "mov reg32_2, reg32_1". As in the previous case, after using Python isinstance() checks to locate instances of this pattern, we generate a Python object representing the x86 instruction "mov esi, esp", and call the MakeRawX86 function (detailed in the previous section) to generate a new "Raw x86" VM instruction to replace the two VM instructions comprising the pattern instance. This process can be seen completely in the function "ThirdSimplify" from the simplification code (search for the function name).

After applying this substitution, the new VM bytecode disassembly listing can be found here.

4.3 The "MOV SCRATCH, 0" / "ADD SCRATCH, IMM32" Pattern

Continuing to look for patterns in the VM bytecode program, I saw the following:

0x0037b0: MOV SCRATCH, 0
0x0037c8: ADD SCRATCH, 0x420344

This sequence can obviously be replaced with the single-instruction sequence "MOV SCRATCH, 0x420344". The function "FourthSimplify" in the simplification code (search for the function name) implements the detection and substitution. Again, it's trivial to write this pattern-recognition and replacement code, though unlike the previously-described pattern-substitutions, the replacement code is a Group #2 "SCRATCH register" FinSpy VM instruction rather than a Group #3 "Raw x86" instruction, since the output involves the scratch register.

After applying this substitution, the new VM bytecode disassembly listing can be found here.

4.4 The "MOV SCRATCH, IMM32" / "PUSH SCRATCH" Pattern

More perusal of the VM bytecode disassembly turned up the following sequence:

0x006900: MOV SCRATCH, 0x000003
0x006918: PUSH SCRATCH

As with previous examples, we can replace this two-instruction sequence with the x86 instruction "push 3", by using a "Raw x86" VM instruction. The function "FifthSimplify" implements this -- it identifies "MOV SCRATCH, IMM32 / PUSH SCRATCH" sequences, and replaces them with a "Raw x86" FinSpy VM instruction object containing the machine code for an x86 "push imm32" instruction, again using identical techniques to those discussed previously.

After applying this substitution, the new VM bytecode disassembly listing can be found here.

4.5 Memory Address Patterns

After performing the aforementioned replacements, we start to see a lot less variety in the remaining Group #2 instructions, and their further purpose quickly became obvious. Namely, each remaining cluster of VM bytecode instructions using the SCRATCH register consisted of two consecutive components: 1) a sequence of FinSpy VM instructions to load a memory address into the SCRATCH register, using what I've called a "memory address pattern"; followed by 2) a sequence of FinSpy VM instructions utilizing using the memory address just generated, for a purpose such as reading from the address or writing to it, using what I've termed a "memory access pattern". We will discuss both such patterns in this section and the subsequent one.

For an example of both a memory address pattern and a memory access pattern, here is the very beginning of the VM bytecode program after all the prior replacements have executed:

0x000000: MOV SCRATCH, EBP                 ; Memory !address!
0x000030: ADD SCRATCH, 0x000008            ; Memory !address!
0x000048: MOV SCRATCH, DWORD PTR [SCRATCH] ; Memory !access!
0x000060: MOV EAX, SCRATCH                 ; Memory !access!

The first two VM instructions set the SCRATCH register to EBP+0x8. These two instructions comprise the "memory address pattern".

The last two VM instructions read a DWORD from the memory address contained in the SCRATCH register, and store the result into EAX. These two instructions comprise the "memory access pattern".

Clearly, these four VM instructions can be replaced by the single x86 instruction "mov eax, [ebp+8]" -- which looks very much like something we'd expect to see near the beginning of a function (suitably, given that the four VM instructions just shown are the first VM instructions in the bytecode program, and are situated toward the beginning of an x86 function). 

For a more complicated example:

0x03c270: MOV SCRATCH, EDX      ; Memory !address!
0x03c2a0: SHL SCRATCH, 0x000003 ; Memory !address!
0x03c2b8: ADD SCRATCH, EAX      ; Memory !address!
0x03c2d0: ADD SCRATCH, 0x000010 ; Memory !address!
0x03c2e8: MOV EAX, SCRATCH      ; Memory !access!

Let's trace the value that is written to EAX at the end. The first two VM instructions shift EDX left by 3; the third VM instruction adds EAX, and the fourth VM instruction then adds 0x10. Thus, the expression written to EAX is "EDX<<3 + EAX + 0x10". EDX<<3 is the same thing as EDX*8, so our expression is "EDX*8 + EAX + 0x10". The format of the memory expression should look familiar -- it can be encoded as the legal x86 ModRM/32 memory expression "[EAX+EDX*8+0x10]". These first four VM instructions comprise a "memory address pattern". The fifth and final VM instruction is the "memory access pattern" instance -- rather than reading from or writing to this memory location, we simply store the memory address itself into EAX. Thus this VM instruction sequence performs the equivalent of the x86 instruction "lea eax, [eax+edx*8+10h]".

Indeed, all of the memory address patterns appear to be creating memory addresses that would be legal to encode using X86 ModRM memory expressions. X86 ModRM memory expressions contain one or more of the following elements added together:

  • A 32-bit base register
  • A 32-bit scale register, optionally multiplied by 2, 4, or 8
  • A 32-bit displacement (an immediate DWORD)

By inspecting the VM bytecode program, all memory address sequences have an identical layout.

  • If an index register is being used, the first VM instruction of the sequence sets the SCRATCH register to the value of the base register. 
  • If the index register is multiplied by a scale factor, the next VM instruction is SHL SCRATCH, IMM32, where IMM32 is 1, 2, or 3 (to multiply the index register by *2, *4, or *8, respectively).
  • If a base register is used, the next instruction in the sequence adds the base register.
  • If a 32-bit displacement is used, the next VM instruction is an ADD SCRATCH, IMM32 instruction.

All of these elements are optional, though at least one must be present. So for example, if the memory address is a raw 32-bit value (e.g. dword ptr [401234h]), only the ADD SCRATCH, IMM32 VM instruction will be present. If the memory expression consists of only a register (e.g., dword ptr [eax]), then only the MOV SCRATCH, REG32 VM instruction will be present. Memory expressions that use more than one element will be virtualized by combining the VM instructions for the elements present.

4.6 Memory Access Patterns

After a memory address pattern just described creates a memory expression in the SCRATCH register, the next one or two VM instructions make up the memory access pattern, and dictate how the memory address is used through how they access the SCRATCH register. By examining the VM bytecode program, I found that there were four distinct VM instruction sequences used for memory access patterns.

4.6.1 Memory Access Case #1: Memory Read, Store Into Register

The first case reads from the memory address, and stores the result in a register:

; ... memory address pattern before this ...
0x000048: MOV SCRATCH, DWORD PTR [SCRATCH]
0x000060: MOV EAX, SCRATCH

This corresponds to "mov eax, dword ptr [memExpression]", with the details of "memExpression" being dictated by the memory address pattern.

4.6.2 Memory Access Case #2: Memory Read, Push Result

The second case reads from the memory address, and then pushes the result on the stack:

; ... memory address pattern before this ...
0x004950: MOV SCRATCH, DWORD PTR [SCRATCH]
0x004968: PUSH SCRATCH

This corresponds to "push dword ptr [memExpression]", with the details of "memExpression" being dictated by the memory address pattern.

4.6.3 Memory Access Case #3: Memory Write, Value Taken from Register

The third case stores a register into the memory location calculated by the memory address sequence:

; ... memory address pattern before this ...
0x000ae0: MOV DWORD PTR [SCRATCH], EAX

This corresponds to "mov dword ptr [memExpression], eax", with the details of "memExpression" being dictated by the memory address pattern.

4.6.4 Memory Access Case #4: Store Address into Register

The fourth case does not dereference the memory location, but rather saves the result into a register:

; ... memory address pattern before this ...
0x000e28: MOV EAX, SCRATCH

This corresponds to "lea eax, dword ptr [memExpression]", with the details of "memExpression" being dictated by the memory address pattern.

4.7 All Together: De-Virtualizing Memory References

After having fully analyzed the remaining references to the SCRATCH register as described above, I wrote code to detect the memory address patterns and the following memory access patterns, analyze them, and convert them back into x86 machine code. The function "SixthSimplify" in the simplification code recognizes memory address patterns, inspects the following instructions to determine the memory access patterns, and combines these two pieces of information to determine which x86 instruction the two memory address/access sequences have replaced. Next, the code reconstructs an x86 instruction -- as a FinSpy VM "Raw X86" instruction -- with which it finally replaces the VM instructions comprising the memory address and memory access sequences. As before, the replacement "Raw x86" FinSpy VM instruction uses the key and position attributes from the first VM instruction as the unique attributes for the replacement instruction.

First, "SixthSimplify" invokes the function "DecodeAddressSequence". That function determines if a given position within a list of FinSpy VM instructions begins a memory address sequence. If not, the function returns None. If so, DecodeAddressSequence extracts details from the memory address sequence -- the base register, the index register and optional scale factor, and the 32-bit displacement -- and uses it to create a Mem32 object (the class used by my Python x86 library to represent 32-bit memory expressions), which it then returns along with the number of VM instructions comprising the memory address pattern. That code is shown below. 

# Given:
# * A list of FinSpy VM instructions in insnArr
# * An index within that list in idx
# 
# Determine if insnArr[idx] contains a memory address sequence.
# If not, return None. If so, create an x86 memory expression
# operand using my x86 library, and return it along with the
# number of instructions in the address sequence.

def DecodeAddressSequence(insnArr, idx):
    # Save position of index within insnArr
    oldIdx = idx
    
    # The first VM instruction in the sequence is usually "MOV SCRATCH, REG32".
    r1 = IsMovScratchReg(insnArr[idx])

    # Was it?
    if r1 is not None:

        # Yes, it was, so increment the current index
        idx += 1

        # Is the next VM instruction "SHL REG, [1/2/3]"?
        if isinstance(insnArr[idx],ShlScratchImm32):
            # Yes, copy the scale factor
            scaleFac = insnArr[idx].Imm32
            assert(scaleFac == 1 or scaleFac == 2 or scaleFac == 3)
            # Increment the current index
            idx += 1
        
        # Otherwise, there is no scale factor
        else:
            scaleFac = None

        # Is the next VM instruction "ADD SCRATCH, REG32"?
        r2 = IsAddScratchReg(insnArr[idx])
        if r2 is not None:
            # Yes, increment the current index
            idx += 1

        # Is the next VM instruction "ADD SCRATCH, IMM32"?
        disp32 = IsAddScratchImm32(insnArr[idx])
        if disp32 is not None:
            # Yes, increment the current index
            idx += 1
        
        # Make a memory expression from the parts, and return the length
        # of the memory address sequence
        return (idx-oldIdx, MakeMemExpr(r2, r1, scaleFac, disp32))
    
    # The second possibility is that the memory expression is a raw address.
    imm = IsMovScratchImm32(insnArr[idx])
    # Was it?
    if imm is not None:
        # Yes: make a memory expression from the address, and return the
        # length of the memory address sequence (namely, 1).
        return (1, MakeMemExpr(None,None,None,imm))

    # If we are here, neither of the memory address patterns matched, so
    # signal match failure.
    return None

Next, a similar function called "DecodeAccessSequence" uses pattern-matching to determine which of the four memory access patterns -- mov reg32, [memExpr] / push [memExpr] / mov [memExpr], reg32 / lea reg32, [memExpr] -- follows the access sequence. The code is similar to the code just shown for decoding memory address sequences, and so is not duplicated here. See the source code for the complete details.

Finally, after recognizing a memory address sequence followed by a memory access sequence, we use the machinery we previously developed for regenerating x86 machine code -- namely, the function "MakeRawX86" -- to create a FinSpy VM instruction containing the machine code for the raw x86 instruction. We use this to replace the memory address and access sequences just recognized.

After running this simplification pass, and all prior ones described for Group #2 instructions, over the VM bytecode program, all Group #2 VM instructions disappear, and consequently the SCRATCH register disappears from the VM bytecode disassembly listing. The final disassembly listing of the simplified FinSpy VM program can be seen in its entirety here.

5. Step #3: Correcting a Small Error

Having dispensed with the Group #2 VM instructions, Groups #1 and #3 remained. Before addressing them, however, there was one VM instruction that didn't fit into either one of those groups. Namely, in producing my initial VM bytecode disassembly listing, I had incorrectly identified the FinSpy VM unconditional jump instruction as being an instruction to cause a deliberate crash. I disassembled this as "CRASH". My FinSpy VM bytecode disassembly listing was confusing with how frequently the CRASH instruction occurred:

0x005bb0: JNZ VM[0x005c88] (fallthrough VM[0x005bc8])
0x005bc8: X86 xor eax, eax
0x005be0: CRASH
0x005bf8: X86 mov eax, dword ptr [esi+4h]
0x005c70: CRASH
0x005c88: X86 push ebx

I discussed this issue at length in part two -- the implementation for unconditional jumps was considerably different from conditional jumps, and involved dynamic code generation, which was only used otherwise for Group #3 instructions. Closer analysis revealed that the true purpose of this instruction was as an unconditional jump and not a deliberate crash. Upon learning this, I updated my disassembler component to rename the "CRASH" instruction to "JMP", and to print the branch targets of these newly-renamed JMP instructions. The resulting VM bytecode disassembly listing was clearer:

0x005bb0: JNZ VM[0x005c88] (fallthrough VM[0x005bc8])
0x005bc8: X86 xor eax, eax
0x005be0: JMP VM[0x008df0]
0x005bf8: X86 mov eax, dword ptr [esi+4h]
0x005c70: JMP VM[0x008df0]
0x005c88: X86 push ebx

The entire VM bytecode disassembly listing after this modification can be found here.

6. Conclusion

In this Phase #1, we inspected our sample's initial FinSpy VM bytecode disassembly listing. We improved the listing by including x86 disassembly for the x86 machine code embedded in the Group #3 instructions. We inspected how the VM bytecode program used Group #2 instructions. A half-dozen simple pattern-replacement schema were sufficient to entirely remove the Group #2 instructions. Afterwards, we corrected the output by observing that the "CRASH" instructions were really unconditional jumps.

In the next Part #3, Phase #2, we are ready to attempt our first devirtualization for the FinSpy VM bytecode program. Our initial attempts wind up being insufficient. We study the deficiencies in Part #3, Phase #3, and remedy them in our second, final, devirtualization attempt in Part #3, Phase #4.